
Using this menu item it is possible to visualise the calculated potentials, velocities or gradients as colour-filled contour lines. A dialog box opens for selecting the required data. A further dialog box then opens, in which the type of visualisation can be modified
The following options are available in the dialog box above (the example shows "Potentials" selected):
-
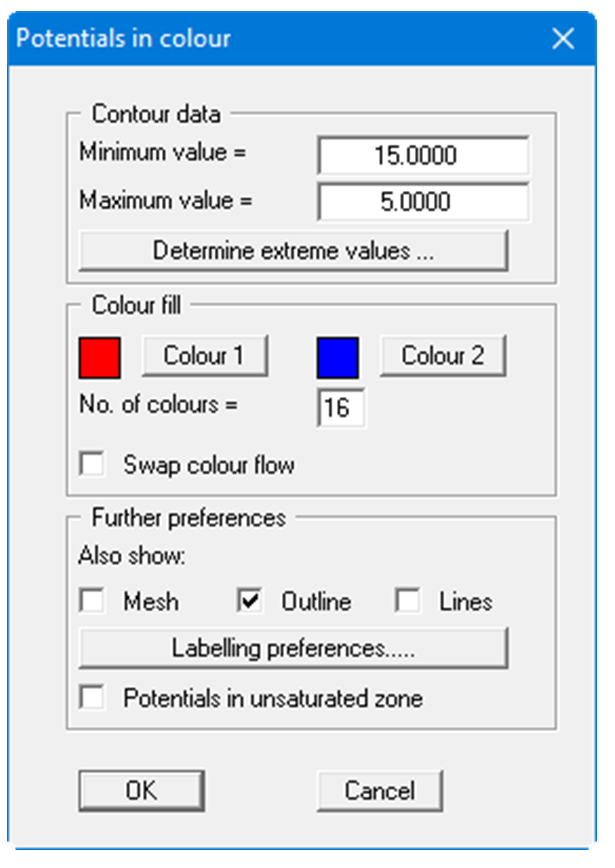
"Contour data" group box
Press the "Determine extreme values…" button. The program then determines the minimum and maximum values for the corresponding layer base. You can then edit these values, for example in order achieve a defined start value. -
"Colour fill" group box
You can control the colour subdivisions of the contour diagram using "No. of colours". In the example above, 16 colours will be displayed between "Colour 1" and "Colour 2". The default setting is a colour course from red to blue. These colours can be edited as required after selecting the "Colour 1" and "Colour 2" buttons, or simply reverse the choice by selecting the "Change colour series" check box. -
"Further preferences" group box
In addition to the colour presentation you can also have the triangle mesh and/or the outline displayed. Additional contour lines can also be drawn. Line labelling preferences can be defined by means of the "Labelling preferences" button. -
"OK"
The colours will be drawn after confirmation.
A colour bar at the right edge of the sheet allows correlation between the colour and the corresponding value. If this colour bar is drawn in the right page margin, specify a larger value for the right plotting margin (e.g. 25 mm) in the "Page size + margins/Page size and margins" menu item.
As the program calculates with unsaturated permeabilities, potentials in the unsaturated zone are the result, which is physically absolutely correct. From experience, this confuses some clients. To save long discussions, switch off the potential lines in the unsaturated zone with the corresponding check box.