
When analysing a number of piles using diameter or length variation, the final results are displayed in a table in the graphics if the "Show output table" check box is activated. You can alter the shape and appearance of the output table.
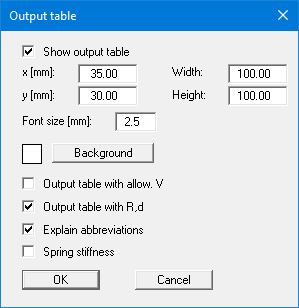
You can define and edit the position of the legend using the values "x" and "y". The size of the legend is controlled by the values for "Width" and "Height". In some legends, you can also adjust the font size of the label and/or specify a background colour.
The fastest way to modify the position or size of the legend is to press the [F11] function key and then to either pull the legend to the new position or to move the sides of the legend to their new size with the left mouse button pressed.
The display of Allow. V and R,d can be activated. An explanation of the abbreviations used is given in the log by activating the lower check box. You can have the spring stiffness displayed here in a further column if you activate the corresponding check box.