
Among other things, the screen graphics consist of several graphs, presenting depth-oriented results. This menu item opens a dialog box which allows you to visualise the selected state variables on the screen by activating the corresponding check boxes.
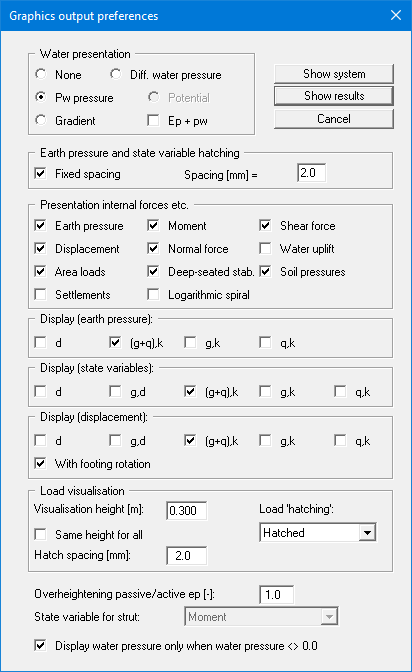
On the whole, the dialog box is self-explanatory. For example, if the "Settlements" check box is activated, the stresses below the footing for the characteristic point are visualised. When "Ep + pw" is selected, the sum of earth pressure and water pressure (pw) is displayed in the diagram for earth pressure.
When analysing using partial safety factors you will also see the group boxes "Display (earth pressure):", "Display (state variables):" and "Display (displacement):", in which you can activate display of the permanent (g) and/or live loads (q). In addition, the design values (d) can be displayed.
You can also specify hatching and the presentation height of loads. If the "Same height for all" check box is not selected, load visualisation is based on load size, the height of the presentation indicating the maximum load.
Leave the dialog box by pressing "Show system". If the system has already been analysed, you can leave the box by pressing "Show results" and then view the result graphics on the screen.