The following options are offered in the "Type of redistribution" group box in the start dialog box of the “System/Analyse” menu item:
-
“Do not redistribute”
The analysis is performed using classical earth pressure redistribution. -
"EAB 1988" and "EAB 2012 / 2021"
Redistribution diagrams are given as a function of anchor positioning in EAB 1988 and EAB 2012 or 2021. The program selects the appropriate redistribution from these diagrams. If no agreement is found an appropriate error message is shown. -
"Rectangular"
Earth pressure is redistributed in the form of a rectangle. -
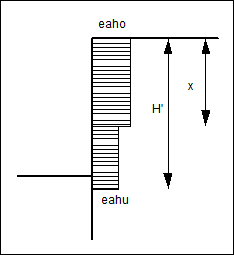
"Birectangular"
Earth pressure is redistributed in birectangular form. The relationship between the top and bottom earth pressure ordinates (eaho/eahu), as well as depth of the subdivision x, can be specified.
-
"Triangular"
Earth pressure is redistributed in the form of a triangle. The associated "Preferences" button enables you to determine the position of the maximum (top, central, bottom). -
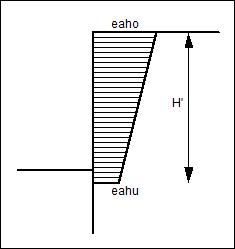
"Trapezoidal"
Earth pressure is redistributed in the form of a trapezoidal. The associated "Preferences" button enables you to determine the eahu/eaho ratio.
-
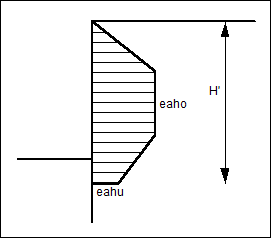
"Quadrilateral"
The earth pressure is redistributed in a quadrilateral. After clicking the "Preferences" button you can select the ordinates at which the maximum should occur, either by entering the depth or, alternatively, the anchor positions. Activate the appropriate check boxes at the left of the dialog box. The ordinate at the base of the wall is defined by the ratio eaho/eahu.
-
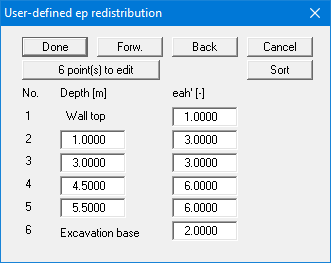
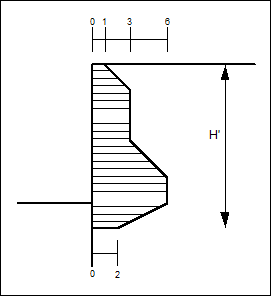
"User-defined"
If all the earth pressure redistributions offered so far do not meet your requirements, you can also carry out any earth pressure redistribution by defining a polygon course using the "Preferences" button.
You can define several depths between the top of the wall and the base of the excavation and assign specific, freely definable earth pressure coordinates to these depths. This creates a polygonal composite surface. The calculated earth pressure is redistributed to precisely this area during subsequent analysis. For the example in the following dialog box, the following image is shown: