
After selecting this menu item a dialog box appears, in which you can edit preferences for graphical presentation.
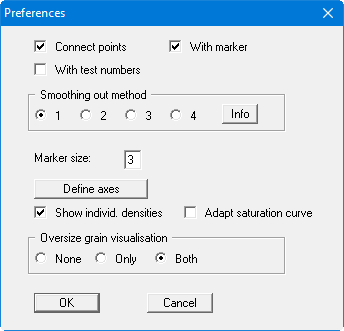
By selecting the "Connect points" check box the measured data are connected to form a Proctor curve. This check box will only be deactivated in rare cases, if a Proctor curve is drawn by hand, for example. Define how the measured data points appear using the "With markers" and "With test numbers" check boxes. The marker size is user-defined. If neither of these check boxes are selected the measured data will not be marked.
Any one of four smoothing out methods can be applied to the Proctor curve visualisation. A message box provides information on the type of smoothing:
Method 1 = strict Bezier spline
Method 2 = "loose" Bezier spline
Method 3 = Newton interpolation
Method 4 = rational spline interpolation
The best method may depend on the individual Proctor compaction test. A general recommendation cannot be given. However, all the examples used in the DIN 18127 can be almost exactly reproduced using the strict Bezier spline. This method is therefore activated by default.
The program automatically selects a sensible axes scale for the visualisation of the Proctor curve. If you select the "Define axes" button you are first offered the automatic scaling values in a further dialog box, which you can then edit as wished. In addition, visualisation of the individual densities, zero air space curve and oversize grain component can be activated and preferences defined.