
Beside input of the test data determined in the laboratory and the subsequent computation of the Proctor curve, it is also possible to enter the water content and associated dry density directly. This is useful, e.g., if you have a graphical Proctor curve from a different laboratory which you would like to use as an appendix in your own report. The following dialog box opens after a confirmation prompt:
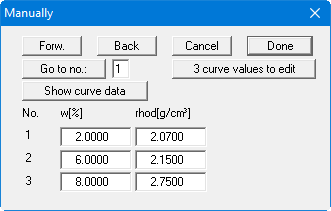
First select the "x curve values to edit" button and enter the number of values to be edited (e.g. "3"). You can then enter the three value pairs (water content and density). After selecting the "Done" button, the test results will be graphically displayed. Existing data pairs can be deleted from the end of the list by reducing the number of entries, but a minimum of two data pairs must remain. The data pairs entered using this menu item are deleted following a confirmation prompt when you go to the menu item "Edit/Tests" for a second time.
The dialog box shows a maximum of 8 value pairs simultaneously. If more than 8 data pairs have been entered you can move through the table with the "Forw." and "Back" buttons or jump directly to the required data pair after entering the number using the "Go to no.:" button. Using the "Show curve data" button the Proctor data for the tests entered can be computed and displayed.