
If you have defined a load increase, the load curve can be displayed in the graphics. In addition to the actual load curve, the step function used as the basis for modelling, resulting from the user-defined consolidation times, is also represented. If the "Show load curve" check box is activated you can edit the representation in the dialog box for this menu item.
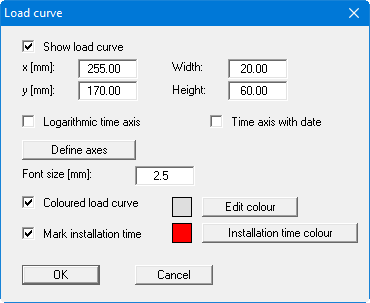
You can define and edit the position of the legend using the values "x" and "y". The size of the legend is controlled by the values for "Width" and "Height". In some legends, you can also adjust the font size of the label and/or specify a background colour.
The fastest way to modify the position or size of the legend is to press the [F11] function key and then to either pull the legend to the new position or to move the sides of the legend to their new size with the left mouse button pressed.
A logarithmic time axis or an additional date display on the time axis can be activated. The date function must be activated in the "File/New" or "Edit/Type of consolidation" menu item dialog boxes for this. Alter the axes selected by the program using the "Define axes" button. In the subsequent dialog box you specify the times and load values as minimum and maximum values to be used for the x- and y-axes.
The "Load curve with colour" check box activates a colour-backing in the specified colour for the load area. Preferences can be defined for the pen colour and width in the menu item "Graphics preferences/Pen colour and width". If vertical drains are subsequently installed (consolidation type "Numerical consolidation with both drain types") the installation time can also be marked in the specified colour.