
If you activate the "Show pore water pressure/consolidation ratio" check box in the dialog box for this menu item, your output sheet will display a graphical representation of the pore water pressure profile across the depth, or the consolidation ratio. A variety of settings are available in the dialog box, depending on the type of consolidation selected and the system defaults.
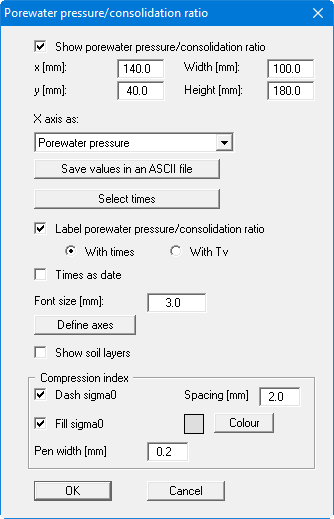
You can define and edit the position of the legend using the values "x" and "y". The size of the legend is controlled by the values for "Width" and "Height". In some legends, you can also adjust the font size of the label and/or specify a background colour.
The fastest way to modify the position or size of the legend is to press the [F11] function key and then to either pull the legend to the new position or to move the sides of the legend to their new size with the left mouse button pressed.
With the help of the combi-box below "X axis as:", the representation of the x-axis can be switched from pore water pressure in [kN/m²] or [MN/m²] to a representation as the dimensionless consolidation ratio UZ. The calculated pore water pressures can also be saved as an ASCII file. Here, you can define the time up to which the values are saved in the dialog box.
The "Select times" button activates the following dialog box where you can select those of the defined times to be displayed in the pore water pressure distribution or consolidation ratio graphics.
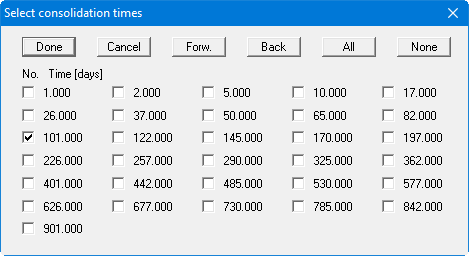
All times are activated by pressing the "All" button. All times are deactivated by pressing the "None" button. This selection is particularly useful because as many points (times) as possible should be used in order to achieve a continuous smooth course in the graphical representation of the temporal development of the consolidation degree. However, too many distribution lines disturb the graphical representation of pore water pressure profiles, as they often merge into one another. If the "Times as date" check box in the above dialog box is activated, the date for the respective consolidation period is shown instead of the time in the selected units.
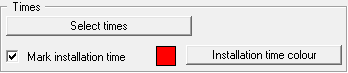
If vertical drains are subsequently installed (consolidation type "Numerical consolidation with both drain types") the installation time can also be marked in the specified colour in the active "Times" group box.
If you activate the "Show pore water pressure/consolidation ratio" check box the distribution lines are labelled with either the "Times" or the auxiliary value "TV". TV is defined as
TV = CV / H² · t
CV = consolidation coefficient = k · ES/γw
H = layer thickness
t = time
Representation of the curve by means of "TV" is generally only useful when re-modelling standardised curves from the literature.
For long consolidation periods it may be useful to label the time axis with the date instead of days or another defined time unit (see the "Example with date.kon" file). Activate the "Times as date" check box to enable this option. The date function must be activated in the "File/New" or "Edit/Type of consolidation" menu item dialog boxes to use this function. It is also possible to define the diagram "Font size" and user-defined axes values. The "Max. ratio" of the x- and y-axes are defined after clicking "Define axes".
If you activate the "Show soil layers" check box, the current soil sequence is displayed in the graphics. This check box is only available when using a numerical method. When modelling with the compression index CC a number of selections affecting the representation can be made in the lower group box of the dialog box shown above.