
If you activate the "Show time-settlement" check box in the dialog box for this menu item, the temporal profile of the degree of consolidation is displayed on the screen.
You can define and edit the position of the legend using the values "x" and "y". The size of the legend is controlled by the values for "Width" and "Height". In some legends, you can also adjust the font size of the label and/or specify a background colour.
The fastest way to modify the position or size of the legend is to press the [F11] function key and then to either pull the legend to the new position or to move the sides of the legend to their new size with the left mouse button pressed.
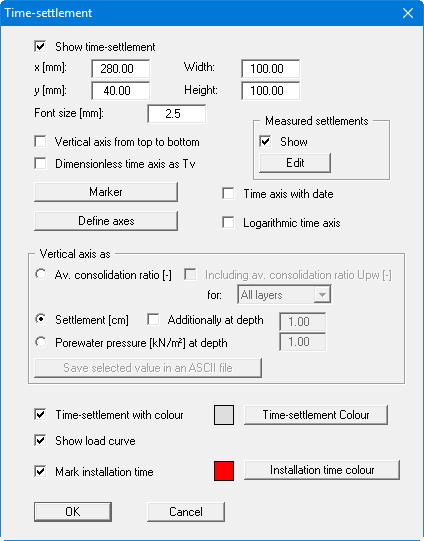
If the "Vertical axis from top to bottom" check box is activated, representation is reversed with regard to the normal representation of settlements. Using the "Dimensionless time axis as TV" check box it is possible to switch representation of the time axis to dimensionless TV values. This is generally only useful when re-modelling standardised curves from the literature.
You can indicate your selected times with a marker; the size, colour and shape of the marker can be specified in a dialog box by pressing the "Marker" button. Alternatively, you can choose user-defined axes or a logarithmic time axis. If the labelling of the time axis is too tight, you can edit the units of time in the "Edit/Type of consolidation" menu item. If the date function is also activated, additional labelling with the date can be achieved in the time-settlement diagram by activating the "Time axis with date" check box.
In the "Vertical axis as" group box you define the variable to be drawn versus the time axis. This also activates further fields for specifying preferences with regard to the selected variable, depending on the chosen representation. In the above dialog box the "Settlement [cm]" option button is activated. So the "Measured settlements" group box is also active and you can display individual measured values, for example measured at on-site settlement gauges, in addition to the calculated settlement curve. The additional measured values are entered into a separate dialog box which opens after you click the "Edit" button. If pore water pressure visualisation is active the pore water pressure values calculated for a given depth can be saved in an ASCII file.
Further graphic elements can be activated at the bottom of the dialog box; the time-settlement area can be colour-backed, for example. If you have defined a load increase, the step function on which modelling is based can be displayed in the graphics by activating the "Show load curve" check box. This makes a separate representation of the load curve unnecessary (see menu item “Output preferences/Load curve”). Preferences can be defined for the pen colour and width in the menu item "Graphics preferences/Pen colour and width". If vertical drains are subsequently installed (consolidation type "Numerical consolidation with both drain types") the installation time can also be marked in the specified colour.