
Among other things, the screen graphics consist of several graphs, presenting depth-oriented results. This menu item opens a dialog box which allows you to visualise the selected state variables on the screen by activating the corresponding check boxes. On the whole, the dialog box is self-explanatory.
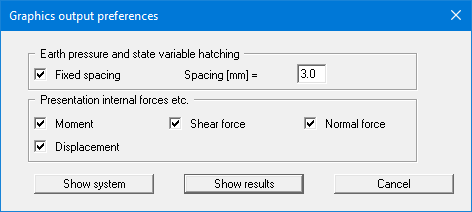
Leave the dialog box by pressing "Show system". If the system has already been analysed you can leave the box by pressing "Show results" and then view the result graphics on the screen.