
If you have analysed your system the detailed analysis results can be shown in a legend by activating the "Show legend" check box. You can alter the position and appearance of the legend.
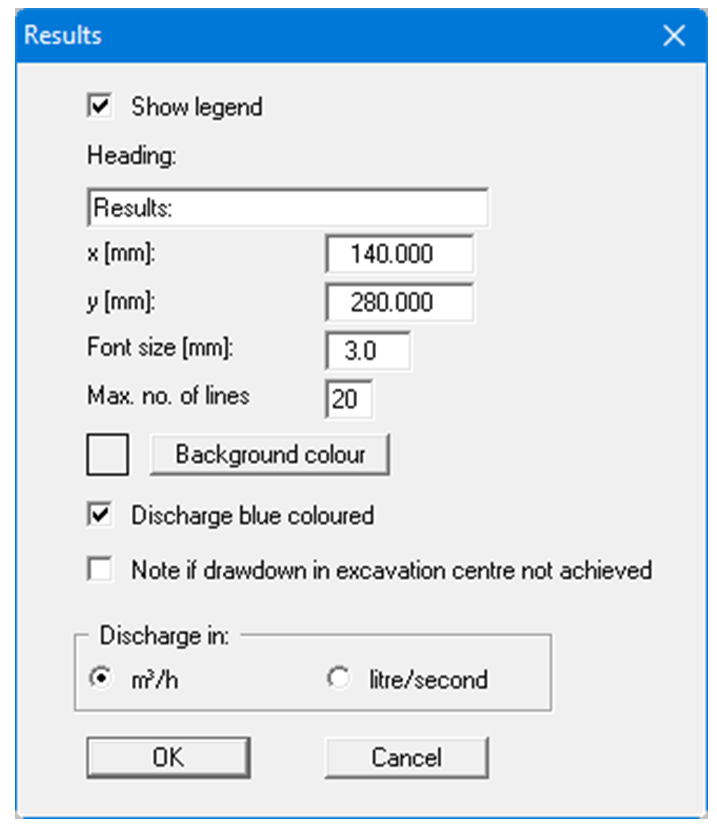
A text can be specified as legend header. You can define and edit the position of the legend using the values "x" and "y". You control the size of the legend using "Font size" and "Max. no. of lines"; where necessary, several columns are used. The fastest way to modify the position of the legend is to press the [F11] function key and then to pull the legend to the new position with the left mouse button pressed.
In order to more easily recognise the discharge Q in the legend, the text can be displayed in blue. Additionally, the discharge dimension can be selected.