
Once your well installation has been analysed the most relevant results are displayed in a number of dialog boxes, which are closed by pressing "OK". Your input data and the analysis results are displayed on the screen in legends. The design of the legends can be edited, or they can be switched off completely, via the menu items "Graphics preferences/Input data legend" and "Graphics preferences/Result data legend".
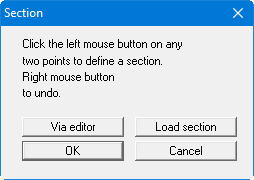
For further evaluation you can use the "Section/User-defined section" menu item. Click "OK" in the dialog box to define a new section using the mouse.
Using the left mouse button, click the start and end points of the required section through the excavation. The number of subdivisions for the section is specified in a further dialog box. This defines the number of model points at which the program calculates and visualises drawdowns along the section. A dialog box then opens for specifying section visualisation settings.
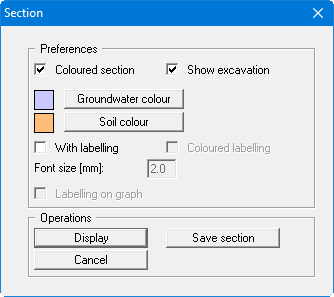
If you accept your settings by pressing the "Display" button, a section through the excavation will be displayed on the screen, which may resemble the following figure, for example:
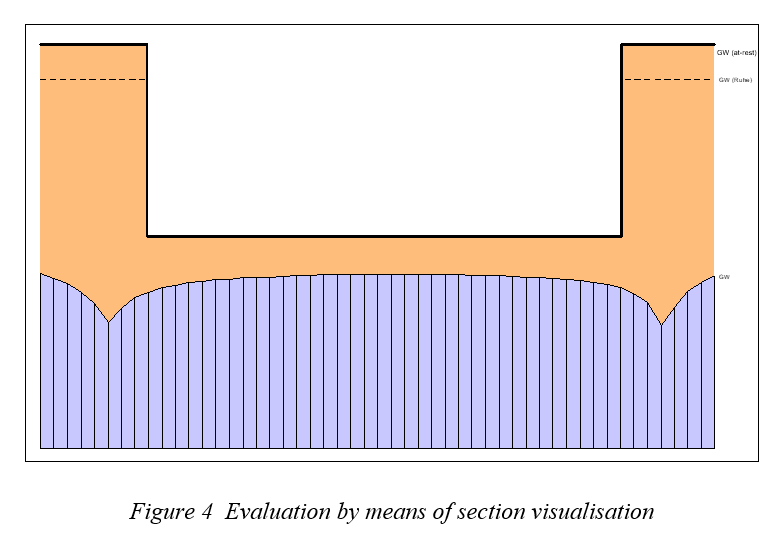
Additionally, a legend will now be shown, with the position of the section in plan (see "Graphics preferences/Section course legend" menu item).
At any editing stage of your problem, you can have the current screen contents printed. Select the menu item "File/Print and export" button "Printer". A dialog box appears, in which you alter the printer alignment from "Portrait" to "Landscape" by clicking on the appropriate button, if necessary. If you are using a printer which cannot take a complete A3 page, then click on the "Fit to page" button. This will calculate a reduction factor (zoom factor), ensuring complete page output to the printer. Otherwise, several pages will be printed. After this, select the "OK" button, in order to start printer output. You can achieve result output as an output table using the menu item "File/Print output table".