
Finally, the stress bulb (lines of equal stress in y-direction) is to be displayed.
For this, select the menu item "Evaluation/Coloured (contours)".
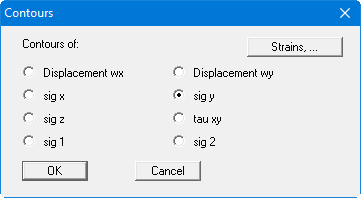
Activate the "sig y" check box and confirm with "OK". The following dialog box will be shown.
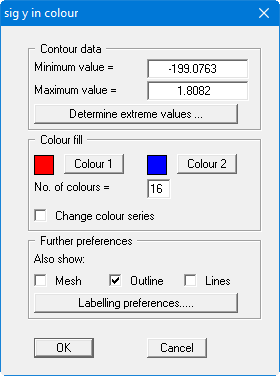
Press the "Determine extreme values" button once and then the "OK" button.
If the colour bar at the right is drawn over the right edge of the sheet, go to "Page size + margins/Page size and margins" menu item and select a larger "Right plot margin. If you would like to print the stress bulb, go to the menu item "File/Print and export".
In a similar manner you can create contours of displacements, strains, etc. (menu item "Evaluation/Normal contours" etc.), or determine bearing forces (menu item "Evaluation/Supports"). You can create circle graphics in which the appropriate state variables are shown as circles of different sizes (value-dependent).
You can freely label the graphics using "Graphics preferences/Mini-CAD toolbar" or create a header for your output sheet using "Graphics preferences/Header toolbar". Please read the Mini-CAD manual.