
This menu item only appears in the "Multiple footings" analysis mode. When the "Show footing analysis diagram" check box is activated, you can define preferences for representation of the footing analysis diagram.
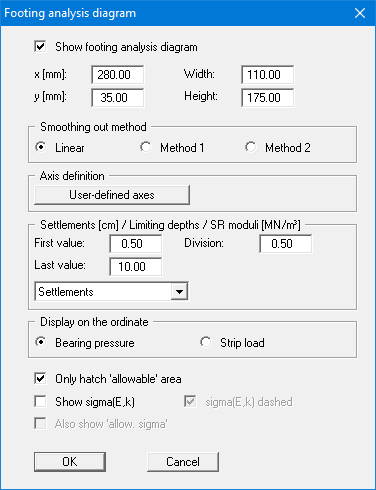
You can define and edit the position of the legend using the values "x" and "y". The size of the legend is controlled by the values for "Width" and "Height". In some legends, you can also adjust the font size of the label and/or specify a background colour.
The fastest way to modify the position or size of the legend is to press the [F11] function key and then to either pull the legend to the new position or to move the sides of the legend to their new size with the left mouse button pressed.
In the second group box the smoothing out method for drawing the graphs for settlement, limiting depths or the modulus of subgrade reaction in the footing analysis diagram can be selected:
-
"Linear" = no smoothing
-
"Method 1" = 'strict' Bezier spline
-
"Method 2" = 'loose' Bezier spline
Using the default settings, the diagram is automatically scaled. If you select the "User-defined axes" button you are first offered the automatic scaling values in a box, which you can then edit as wished.
In the fourth group box you can influence the representation of the settlement curves. The settlement curves are represented in the diagram using the three numbers given in the box above. The program calculates the settlements corresponding to a given footing width by means of linear interpolation. If the limiting depth is calculated using the "% condition" (see Worked example 1) and you have activated the "Stress variable" check box in the "Edit/System parameters" menu item (see "Theoretical principles: Settlement analysis"), limiting depth curves or SR moduli curves can be represented instead of settlement curves.
The bearing resistance design value to EC 7 or the (allowable) bearing pressure, or the (allowable) strip load or point load can be selected for visualisation on the y-ordinate in the diagram when analysing using the partial safety factor concept. If the global safety factor concept is employed either the allowable footing pressure or the allowable strip or point load can be selected.
If you activate the "Hatch allowable area" check box, reference lines are drawn in the allowable area only. Otherwise, lines are drawn across the whole of the plan width and height. Moreover, additional scaling of the footing analysis diagram using the values for sigma(E,k) can be activated here.