
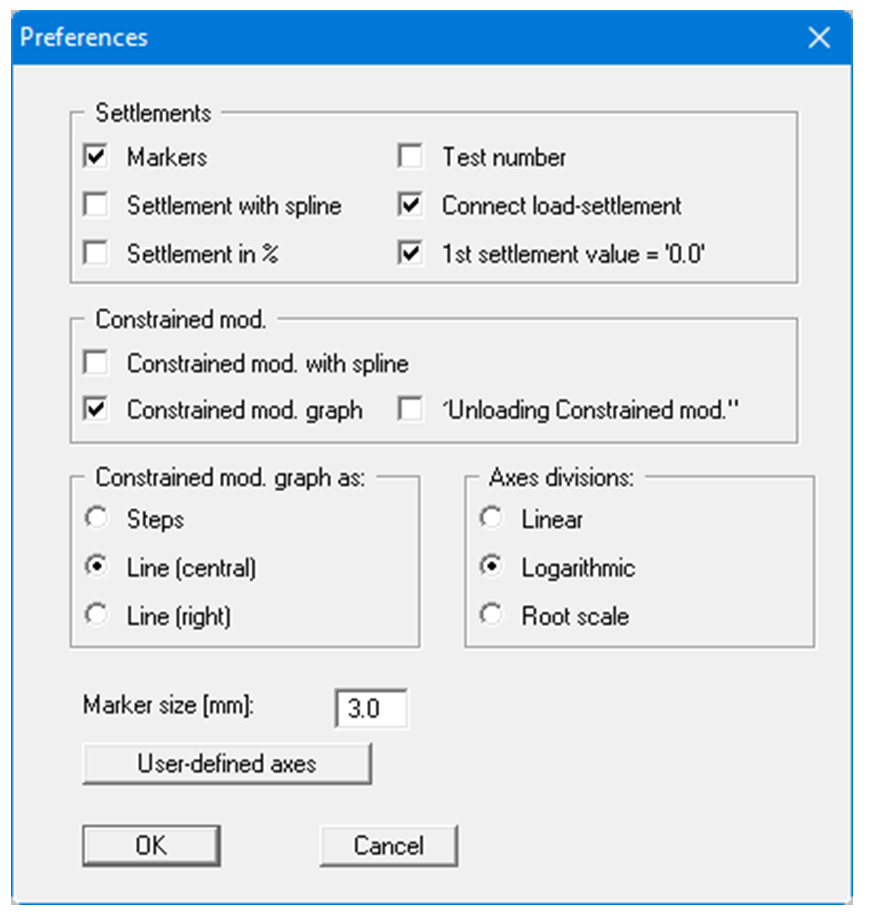
This menu item allows settings to be specified for the graphics. The following dialog box opens for constrained modulus evaluation. The dialog group boxes are adapted to suit the corresponding evaluation diagrams when evaluating using compression indices.
-
"Settlements" group box:
The use of markers or test numbers for the data points is specified by activating the appropriate check box. The marker size or font size of the test numbers is user-defined. If neither of these check boxes are selected the measured data will not be marked.
Activate the "Connect load-settlement" check box to get a graph. The graph can be displayed as a spline, the settlement in either [mm] or in [%]. When evaluating using compression indices the void ratio can be visualised as an alternative to the settlements
-
"Constrained modulus" group box:
If the "Constrained modulus graph" check box is activated the graph is also visualised here with or without a spline. In addition, the unloading can be visualised. When evaluating using compression indices the "Compression index" group box is visible here, with the same options as the constrained modulus visualisation -
"Constrained mod. graph as:" group box:
A number of visualisation types can be selected ("Steps", "Line (central)" and "Line (right)". The position of the marker in the graphics is appropriately adapted. Graph settings can be specified here when evaluating using compression indices. -
"Axes divisions" group box:
The required axes divisions for visualisation of the normal stress can be selected in this group box. The type of visualisation selected always applies to all displayed diagrams. -
"User-defined axes" button:
The program automatically selects a sensible axes scale for the graphical visualisation of the evaluation diagram. If this button is clicked a dialog box opens in which the check box "Use the following axes values" must be activated. The required minimum amd maximum values can then be entered.