
Once the time data has been imported you will see a prompt asking which data you would like displayed at which points.You can have the temporal development at all activated nodes plotted at the same time by clicking the "All" button. If you only want to display a few of a large number of nodes, you can first delete all marking by pressing "Nothing" and then activate the desired nodes. You can invert the markings by pressing "Invert", i.e. all activated nodes are deactivated and vice versa.
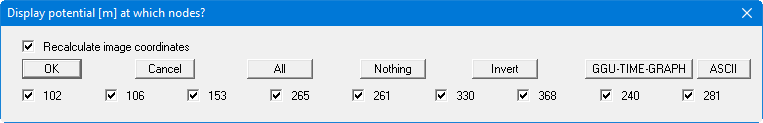
All hydrograph nodes with the computed state variables can be saved as a ".gis" file for use with the GGU-TIME-GRAPH program. When exporting, you define the start time in a small dialog box. Using the "ASCII file" button, the data can be saved in a record that can be represented as a table, for example, in your word processor. The following dialog box is displayed once the nodes are selected:
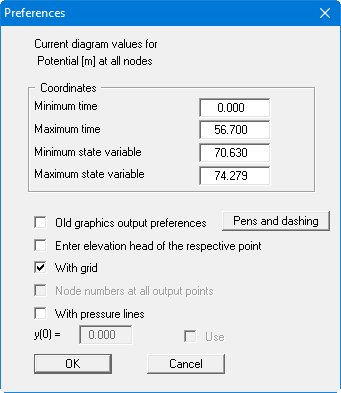
The box shows you the minimum and maximum values at the node points. If you have not chosen the old visualisation format with the same colour and uniform dashing, you can use the "Pens and dashing" button to adapt the colour and dashing for the selected nodes according to your wishes. The grids and pressure lines can also be adapted.