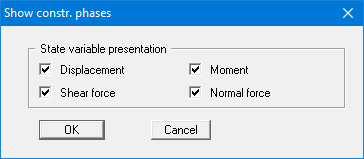
Among other things, the screen graphics consist of several graphs, presenting depth-oriented results. This menu item opens a dialog box which allows you to visualise the selected state variables on the screen by activating the corresponding check boxes.
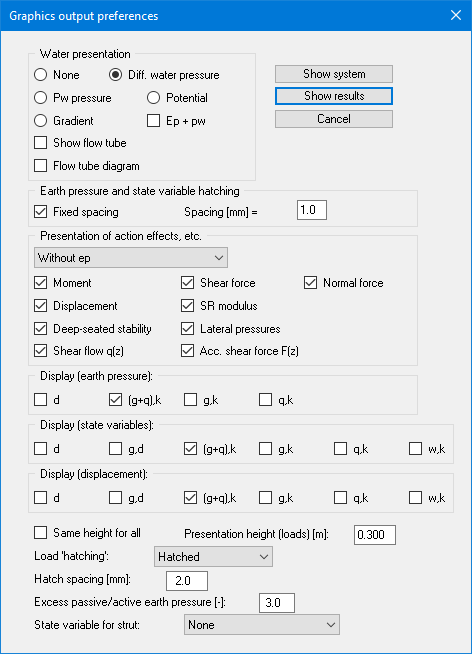
On the whole, the dialog box is self-explanatory. When "ep + pw" is selected, the sum of earth pressure and water pressure (pw) is displayed in the diagram for earth pressure. If a system has been analysed using 2nd order theory with buckling analysis to DIN EN 1993-1-1 activated, either the "Displacement" or the "Pre-curvature" can be selected for display in the result graphics in the dialog box shown above. Any adopted pre-curvature will always be given in the output table.
With version 12.34, the additional internal force derivatives shear flow q(z) and accumulated shear force F(z) have been added. These are automatically filled in by the calculation and displayed together with the shear force line! If no shear force is selected, the results are superimposed on the moment line.
When analysing using partial safety factors you will also see the group boxes "Display (earth pressure):", "Display (state variables):" and "Display (displacement):", in which you can activate display of the permanent (g) and/or live loads (q). In addition, the design values (d) can be displayed.
You can also specify hatching and the presentation height of loads. If the "Same height for all" check box is not selected, load visualisation is based on load size, the height of the presentation indicating the maximum load.
Leave the dialog box by pressing "Show system". If the system has already been analysed, you can leave the box by pressing "Show results" and then view the result graphics on the screen.
When you are working with a particular construction phase (menu item “Construction phases/Display summary”) the following dialog box appears: