
This point represents the program's central menu item. Almost all the sieving and/or hydrometer test data are entered here. As an example, after clicking this menu item the following dialog box opens:
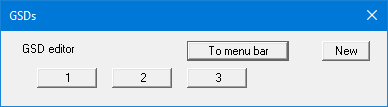
Three tests are already present in this example. The tests are automatically numbered and the test numbers ("1, 2, 3, ...") shown on the respective buttons. The following actions are possible:
-
"To menu bar"
You return to the original menu bar. -
"New"
You can now enter data for a new test. -
"1", "2", ...
By clicking the buttons labelled with the test numbers you can open and edit the data for the corresponding test.
Presentation of the grading curves and the corresponding columns or rows in the diagram table always follows the sequence of the test numbers.
The presentation sequence can be altered by going to "Edit/Swap GSDs". The selected tests are then assigned the specified new test numbers.
After clicking on "New" or on the button of an existing test a dialog box opens for entering the test data. You can access the editor quickly by double-clicking in the table region containing the required grading curve.
The input boxes and command boxes marked in red in the following dialog box must be filled in or selected regardless of the type of test. The unmarked command boxes and input boxes in the following dialog box are activated or filled in dependent on the test type. They are therefore described in the following sections in accordance with the test type.
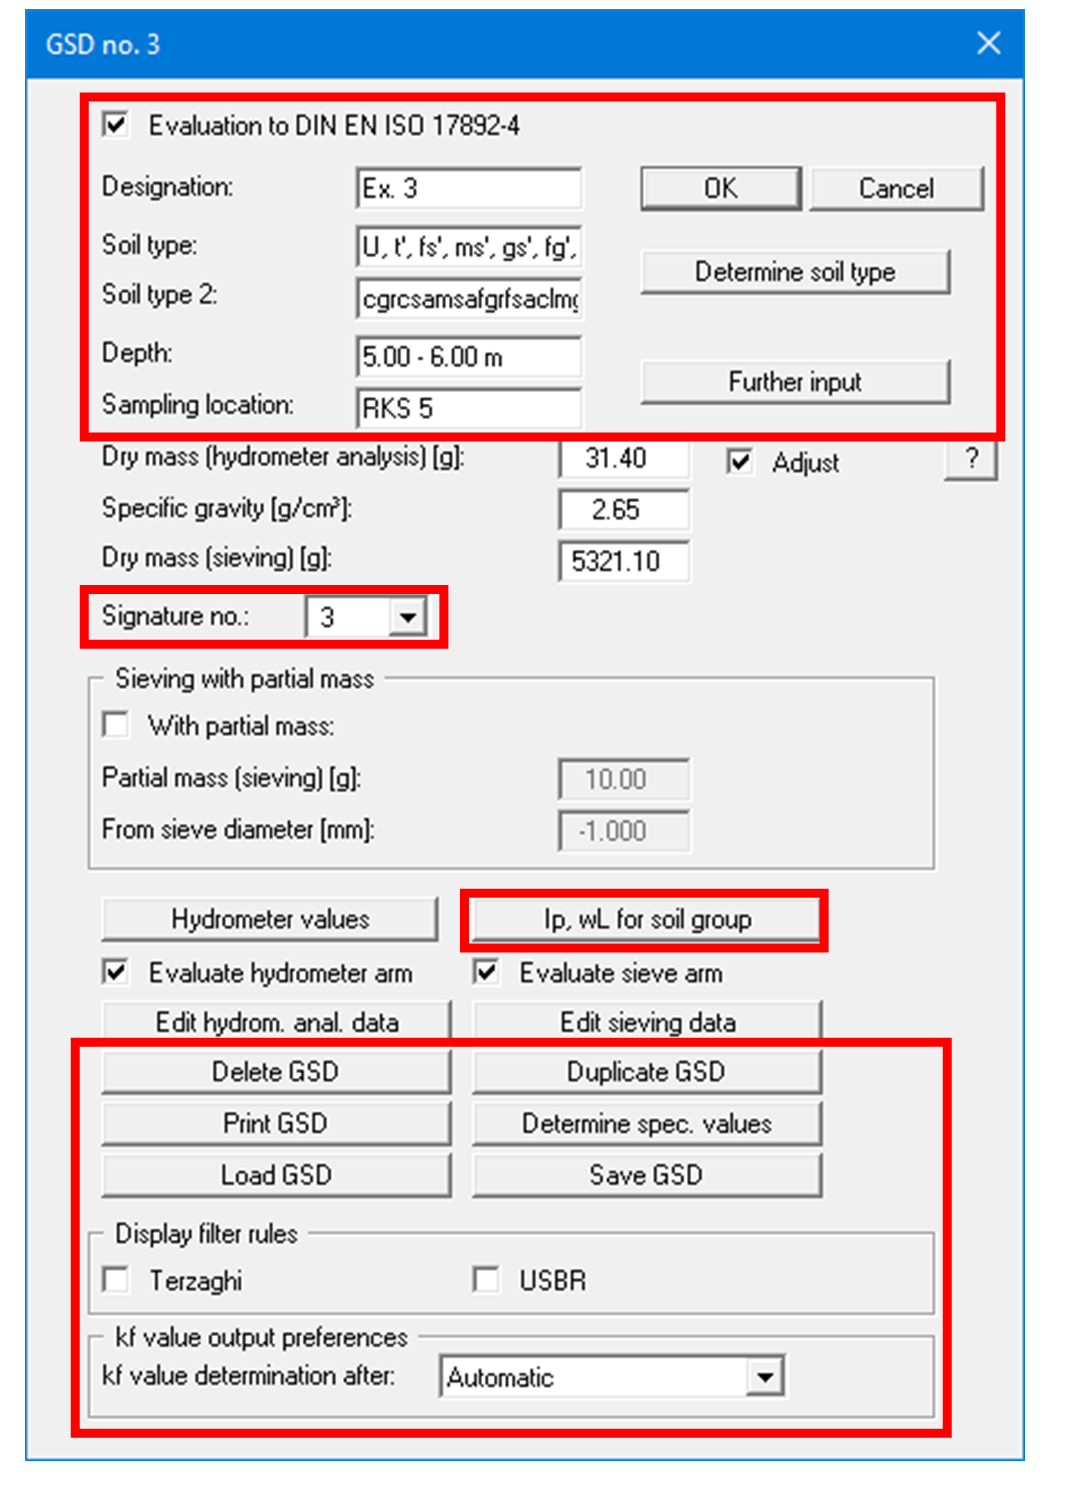
The texts in the input boxes in the upper marked region can, if required, be shown in the table on the output form (see Section "Output preferences/Texts + table" menu item, button "Edit texts and allocations").
The following input or actions can be carried out regardless of the type of test:
-
"Evaluation to EN ISO 17892-4"
If the check box is activated, input and evaluation are compliant with EN ISO 17892-4. -
"OK"/"Cancel"
You exit the dialog box. Any changes made are accepted using the "OK" and rejected using the "Cancel" button. -
"Designation"
You can enter any designation for the test. If it is a newly created test, the program initially awards the next test number in sequence. For example, if two tests already exist the next new test is given the designation "3". If the designation is to be displayed on the test buttons, deactivate the "Editor with GSD no." check box in the "Graphics preferences/ Preferences" menu item. -
"Soil type"/"Soil type 2"
You can enter the soil type by hand or edit the soil type determined by the program, e.g. by entering U, s in place of U, gs', ms', fs'. -
"Determine soil type"
After entering your test data two soil types can be determined by the program in accordance with the user-selected standard by pressing this button. The soil types are automatically included in the "Soil type" and "Soil type 2" input boxes and subsequently entered in the diagram table (see Section "Diagram table" group box).
The overline shown on accessory soil types with a constituent proportion of more than 30-45% (e.g. soil type: very silty) is affected by entering "@" in front of the letter to be overlined.
The "@u" character string in the "Soil type" input box is thus displayed on the form on the screen and in print as "ū".
-
"Depth"
You can enter information on the depth from which your sample was taken. The unit must also be entered as text. -
"Sampling location"
You can enter a more detailed description of the sampling point, e.g. Sampling point 1. -
"Signature no.:"
If you want to assign a specific signature to each grain size distribution, you can choose between 10 signatures. The selection menu is only displayed if you have previously deactivated the "Assign signature automatically" check box in the "Graphics preferences/Preferences" menu item. -
"Further input"
You will see this button for entering additional texts only if the "Free text" option was used when defining the texts in the diagram table using the menu item "Output preferences/Texts + Table", "Edit texts and allocations" button. -
"Ip, wL for soil groups"
The program identifies the soil groups to DIN 18196 from the given test data if this function has been activated in "Output preferences/Texts + Table", "Edit texts and allocations" button.
The coefficient of plasticity IP and the liquid limit wL must be provided for cohesive soils in order to identify the soil group to DIN 18196 (see the following dialog box). Otherwise, nothing will be displayed in the diagram table on the output form.
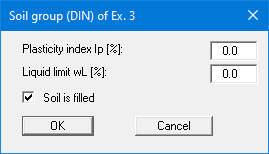
You can achieve visualisation of the DIN 18196 soil group for a filled soil, e.g. [GW], if the "Soil is filled" check box is activated.
-
"Delete GSD"
After a confirmation prompt the currently displayed test is deleted. -
"Duplicate GSD"
The currently displayed test is duplicated. You are automatically relocated to the next test (= new test designation). All the data used in the old test are transferred to the new one and can be edited. -
"Print GSD"
The current test's data can be output as a laboratory log. If the "Normal" button is selected in the opened dialog box, proceed as described in the "File/Print 'simple' output table" menu item. After clicking the "ASCII" button the current test's data are saved in a ".txt" file. This may then be edited in a word processor, for example. -
You can print the data for the current test as a laboratory output table or save it as a file. Further details on output can be taken from.
-
"Determine spec. values"
Special values (grain diameters for given percentages, uniformity coefficient, kf, etc.) are calculated for the current test and displayed on the screen in message boxes. -
"Load GSD" and "Save GSD"
You can save the data for the current grading curve in a separate file with the extension "*.ekv" or load a previously saved grading curve. All the input data in the above "Grain size distribution" dialog box are included in the file and the test data for the hydrometer and/or sieving tests.
If you choose to "Load GSD", the data for the test being currently edited will be overwritten.
If you would like to add a further test using "Load GSD", you must therefore first create a new test using the "New" button in "Edit/Grain size distribution" and then click "Load GSD".
-
"Display filter rules" group box "Terzaghi" and "USBR"
By selecting these boxes it is possible to display the Terzaghi and USBR (United States Bureau of Reclamation) filter rules for the current grading curve. -
"kf value output preferences" group box
If you have activated the "kf value determination via "Edit/Grain size distribution"" check box in the "Output preferences/Texts + table" menu item "Edit texts and allocation" button, you can define the kf value determination method separately for each grain size distribution. The "Automatic" setting is helpful, as the program then searches for the appropriate method.