
In the "Diagram table" group box in the above "Texts + table" dialog box the required texts, text allocations and type of visualisation can be edited.
-
"Edit texts and allocation"
A dialog box opens for specifying the parameters and properties to be displayed in the diagram table. It is possible to display up to a maximum of 11 lines. The sequence corresponds to the numbering in the following dialog box.
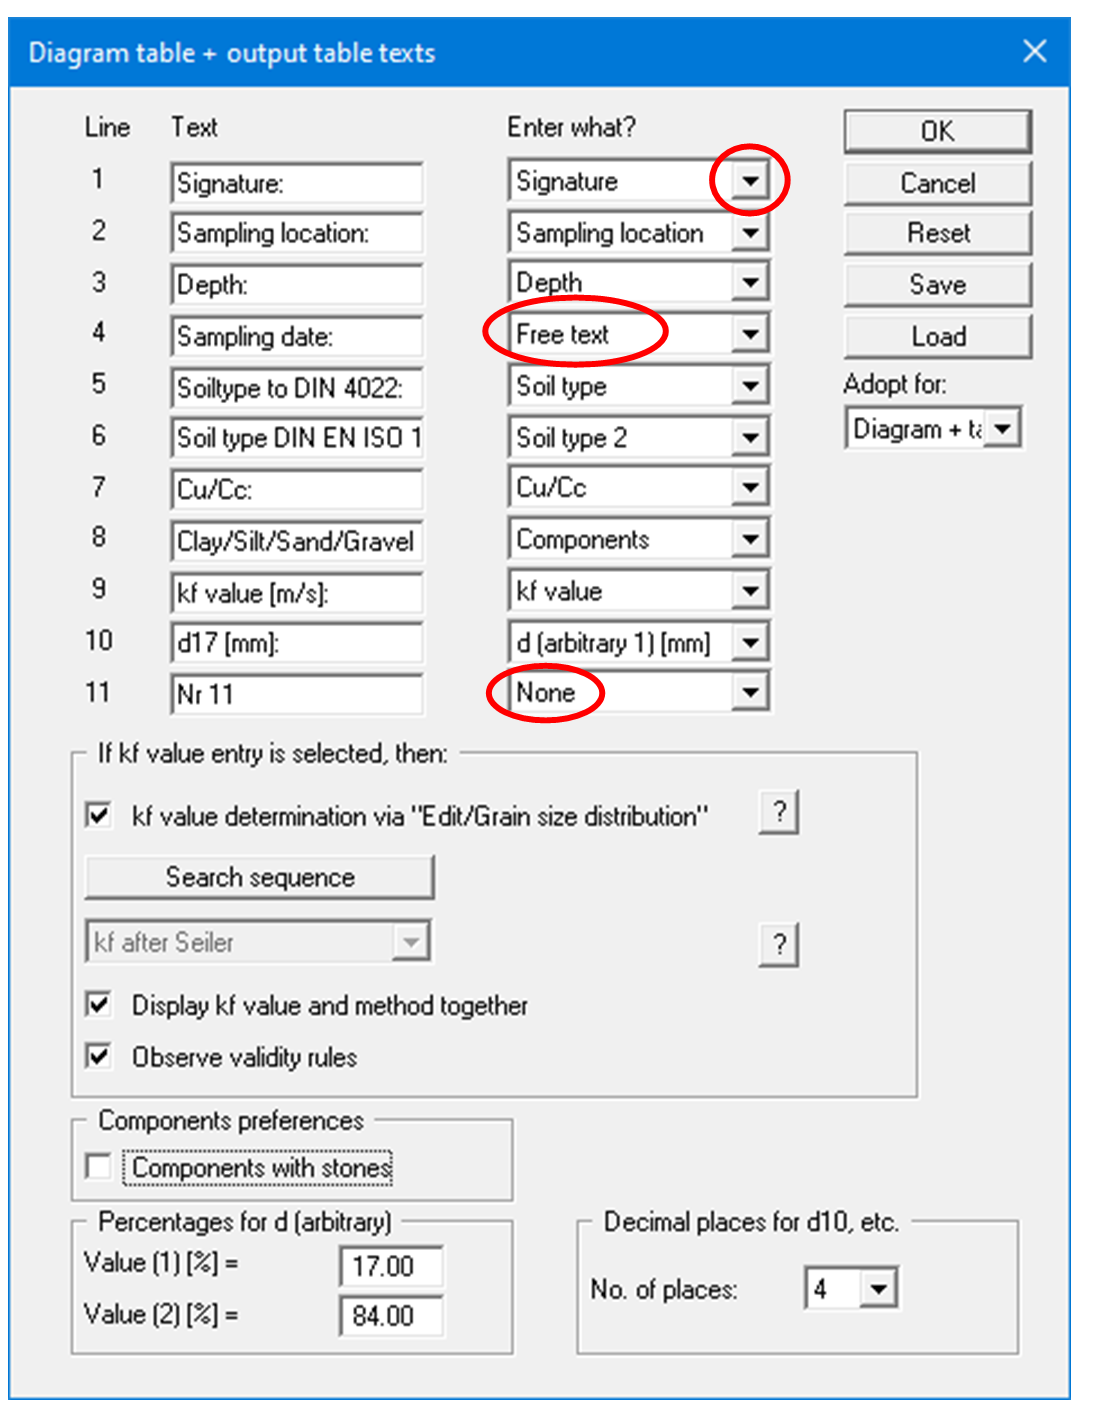
In the "Text" boxes a text must be entered by hand which is later used as a description. After clicking the arrows in the "Enter what?" column the values or text in the drop-down list entered or determined by the program can be allocated to the to the rows of the diagram table.
Lines with a "None" allocation are not displayed.
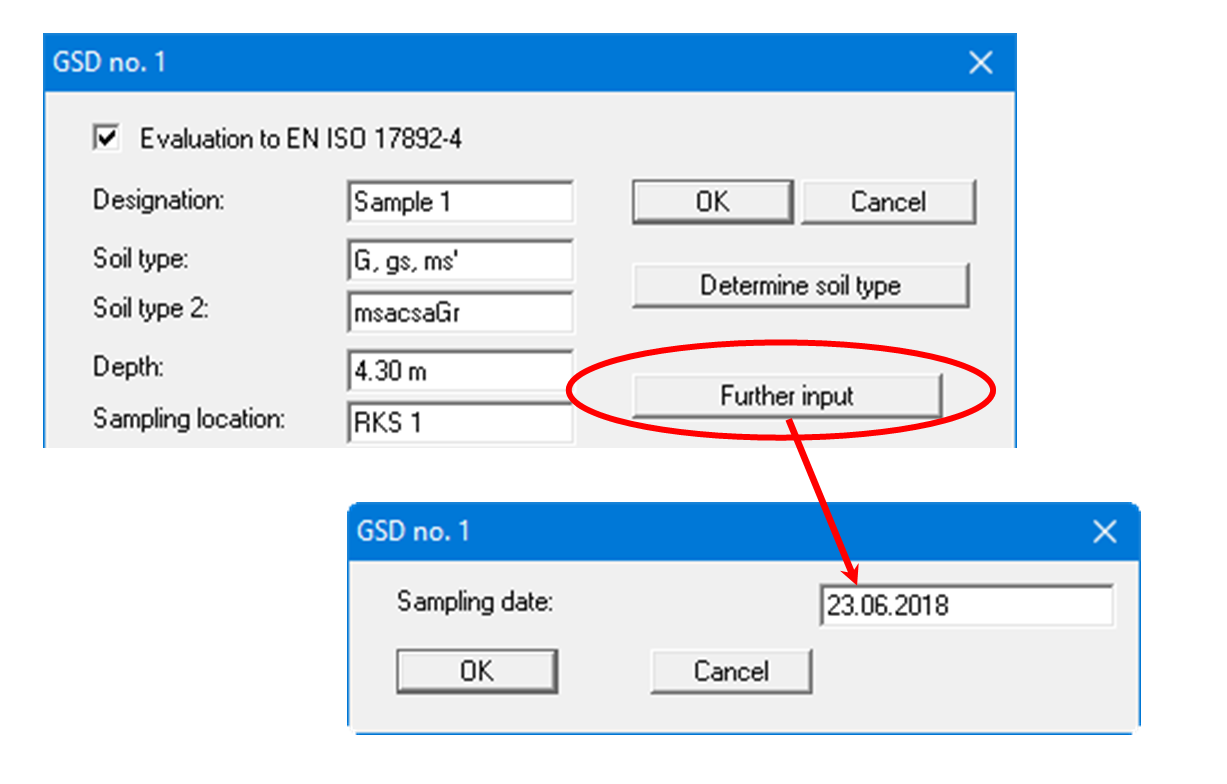
If information needs to be added to the table that is not found in the default texts in the table, a "Free text" can be used. In the menu item "Edit/Grain size distribution" you will then see an additional "Further input" button and can enter text according to your requirements in the dialog box.
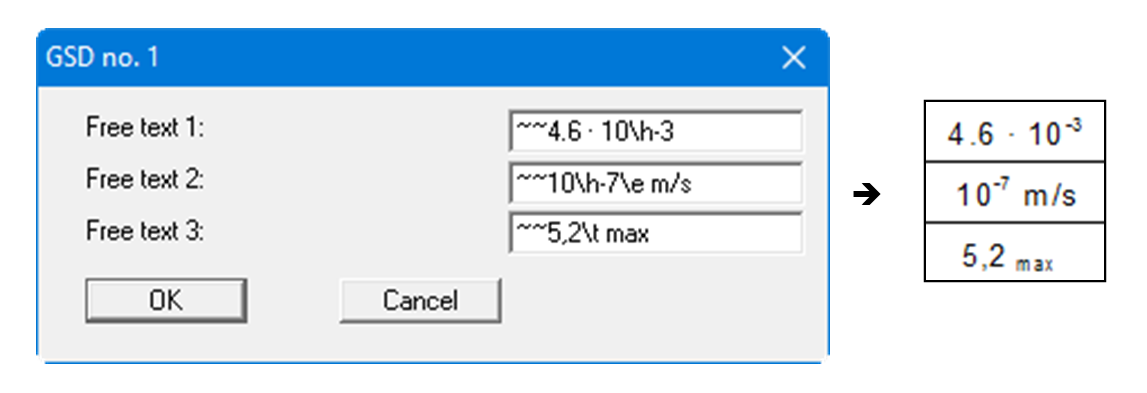
In the Free texts you can make input with superscript or subscript numbers or letters using the conventions described below. To start the text, enter two '~~' characters. Superscripts and subscripts are activated using the backslash combinations '\h' and '\t'. If you need to use normal characters again following the superscripts or subscripts, follow them by '\e' before continuing normally (see file "Free texts with superscript-subscript.kvs").
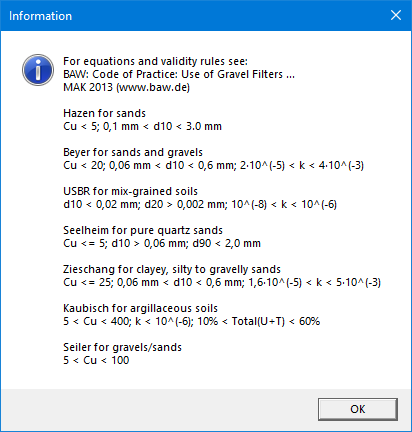
The kf value is determined in accordance with the Merkblatt Anwendung von Kornfiltern an Bundeswasserstraßen (MAK) (Fact Sheet for the Application of Grain Filters on Waterways), published by the Bundesanstalt für Wasserbau (BAW) in Karlsruhe (2013).
If you want to display the kf value in the diagram table, you can select one of the various determination methods for all grain size distributions in the following group box. However, the check box "kf value determination via "Edit/ Grain size distribution"" is activated by default. You can then select different methods in the editor of the respective grain size distribution or, if "Automatic" is set there, have the system search for the appropriate method. You can change the search sequence by clicking on the corresponding button.
If you leave the "Display kf value and method together" check box activated, the method used is also displayed when a kf value entry is made in the diagram table. The respective validity rules should be observed, which is why the check box is activated by default.
More detailed explanations of the methods can be found in an info box, which you can access by clicking on the "?" button:
If you are working in the stone area, you can expand the automatic display of the soil components in the diagram table accordingly by activating the "Components with stones" check box. You must adapt the table text "Clay/Silt/Sand/Gravel [%]:" manually.
Visualisation of the passages at d10, d30, d50 and d60 can be selected from the list. It is also possible to display the passages for any two percentage values. To do this, select the text allocation "d (arbitrary 1) [mm]" (see line 10 in the above dialog box) and enter the required percentage in the bottom group box. The text in the left column must be adjusted accordingly. The number of places after the decimal point can be selected for displaying the passages.
The "Reset" button resets the labelling and allocations of the results table to the defaults. If you have retroactively changed the language, you will get the internal program translations. Your texts and allocation can be saved in a "*.ktx" file using the "Save" button and opened again using the "Load" button. In addition, you can specify whether the current texts and properties allocations are applied to the diagram and/or the output table.
-
"Edit widths"
If the table is arranged vertically, a fixed width for each column can be defined using this button. Please note, however, that the total width of the table needs to fit into the layout of your output sheet. In order to achieve a uniform distribution within the specified total width, e.g. as defined using [F11], click the "All the same width" button. -
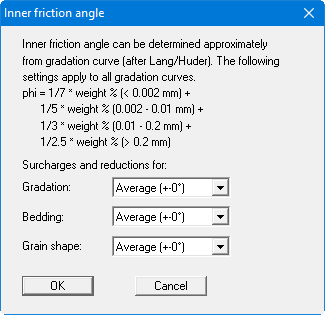
"Inner friction angle"
If the program is to estimate the inner friction angle, surcharges and reductions can be taken into consideration here:
-
"Arrange horizontally"/"Arrange vertically"
This command button defines the alignment of the diagram table. -
"Wrap too long texts"
The program adapts the font size of the texts in the columns and rows automatically to the space available. The text may therefore appear very small for long input. If this check box is activated, the font size remains constant, but the text is wrapped and shown on several lines if necessary.