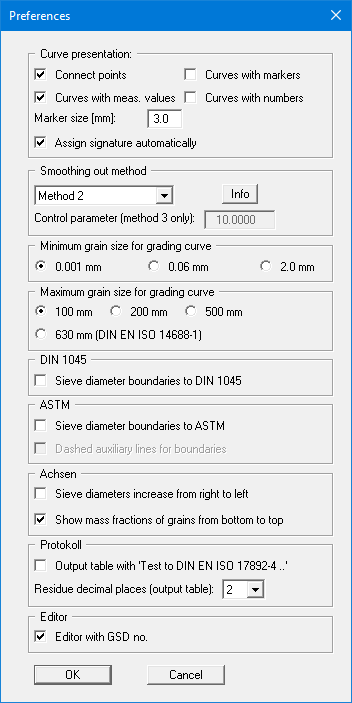
After selecting this menu item, a dialog box appears, in which you can edit preferences for graphical presentation. All preferences made here can be saved at the program level using the "Graphics preferences/Save graphics preferences" menu item in a file named "GGU-SIEVE.alg". The preferences are then automatically loaded when the program is started.
-
"Curve presentation" group box:
By activating the appropriate check boxes the measured data can be visualised as a grading curve, provided with markers at given intervals or directly attached to the measured data.
Each grading curve uses a different marker, thus ensuring simple differentiation between several grading curves, even on monochrome printouts. The marker size is user-defined. Instead of markers, the curves can also be labelled at their start and finish with the test numbers they represent.
If you want to define yourself which marker/signature should be used to display a grading curve, deactivate the "Assign signature automatically " check box. A selection menu then appears in the editor for each grain size distribution, which can be used to assign 10 different signatures. -
"Smoothing out method" group box
You can choose between 4 methods, which are explained in the info box.
No smoothing = no smoothing
Method 1 = strict Bezier spline
Method 2 = "loose" Bezier spline
Method 3 = rational spline interpolation
Smoothing out methods 2 and 3 produce very round curves. The deviations between the measured values and the displayed grading curves become visible when the measured values of the test are marked.
For method 3, smoothing can be influenced by the "Control parameter". The value of the control parameter may only be in the range between > -1.0 and < 1000.
If you display the proportions T/U/S/G [%] in the diagram table, the proportions are determined from the curve. To obtain a more accurate approximation, change the Smoothing out method here or switch to "No smoothing". -
"Minimum grain size for grading curve" group box
For coarse sample material, you can reduce the evaluation range for the fine grain component in the graphics in order to be able to select a better representation of the coarse grain range. -
"Maximum grain size for grading curve" group box
For very coarse sample material you have the option of extending the evaluation range for the coarse grain component shown in the graphics. Additionally, it is possible to activate a display containing the grain component up to 630 mm diameter to EN ISO 14688-1 (= blocks). -
"DIN 1045" group box
If you activate the "Sieve diameter boundaries to DIN 1045" check box, the [mm] specifications in the "Maximum grain size for grading curve" area above are adjusted according to the values from DIN 1045. You can then select the desired maximum grain size. The display of the grading curve in accordance with DIN 1045 always starts at 0 mm. -
"ASTM" group box
After activating the "Sieve diameter boundaries to ASTM" check box the diameter boundaries can be displayed to suit the requirements of the American Society for Testing and Materials (ASTM). As a guidance aid you can also use dashed reference lines to mark the boundaries. If you have not used this previously, once you have activated the ASTM visualisation you will be asked whether the soil types and soil groups should also be determined compliant with ASTM. If you agree, the program automatically sets the corresponding check boxes, which you will find in the "Output preferences/Texts + table" menu item, to ASTM . -
"Axes" group box
You can use the two check boxes "Diameter increase from right to left" and "Show mass proportions from bottom to top" to redesign the graphic according to your requirements -
"Output table" group box
If the "Output table with 'Test to EN ISO 17892-4 ..'"check box is activated, the DIN EN ISO 17892-4 test type is displayed on the output table sheets.
You can specify the number of decimal places for the residue in the output table. -
"Editor" group box
The buttons for the tests entered via "Edit/Grain size distribution" are labelled with the corresponding test number. If you deactivate the "Editor with GSD no." check box, the buttons are labelled with the entered designation. However, only the first 8 characters are used for this.