
The default screen visualisation is the grading curve graphics. If you go to the "View output table" menu item, the following dialog box opens:
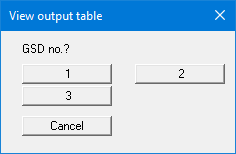
The "1", "2" etc. buttons represent the tests entered. A log page displaying the most important test data opens for each test. They can be printed via the menu item "File/Print and export" .
If you are viewing the output table, you can navigate between the output tables for the individual tests using the arrow tools ![]()
![]()