
After selecting the required parameter, you will see the following dialog box for defining the section:
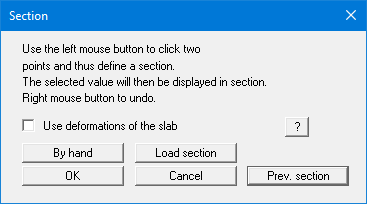
For this type of evaluation, the section course is no longer bound to the FEM nodes but consists of a start and an end point. Using the "By hand" button you can specify the start and end points using numerical values instead of the mouse. If you have previously saved a section, it can be loaded again using "Load section". The "Prev. section" button is only visible if a section has already been defined and loads the section defined immediately prior.
If you activate the "Use deformations of the slab" check box, the settlements of the elastically isotropic half-space are not used, but the deformations of the slab are used instead.
After completing the section definition by pressing [Return] the number of subdivisions can be specified in a further dialog box. You use it to define at how many points intersection values are to be calculated. After confirming with "OK" the dialog box you see on the following page appears.
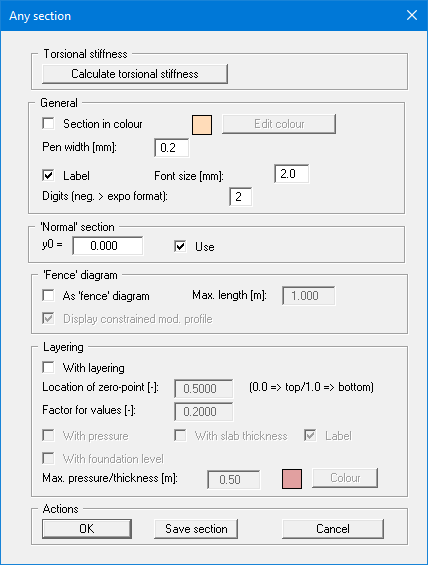
After clicking the "Calculate torsional stiffness" button, the input data and the results of the torsional stiffness calculations are subsequently displayed in a message box. The data then be copied to the Windows clipboard by pressing the "Copy data to clipboard" button. After confirming the message box, you are returned to the original section editor box. The calculated torsional stiffness is later displayed in the General legend.
You can now specify whether the section should be displayed in colour. You can also define the intercept of the x-axis with the y-axis by entering a value for "y0". In this case the "Use" check box must be activated. If you do not use this option, the x axis will intercept the y axis at the smallest y value. The section can also be displayed as a fence diagram.
If you need to display the soil layering, activate the "With layering" check box. Using the "Factor for values" you can alter the size of the displayed state variable or the reinforcement. The location of the zero point for visualisation of the state variables within the layering visualisation is defined between 0 (top) and 1 (bottom). In addition, pressure and foundation levels can be displayed.
You can save the section to load it again at a later date (see above).
If you have activated "Show section course" using the menu item "Graphics preferences/Section legend", a location sketch is automatically displayed on the screen showing the slab outline and the defined section.