
After selecting this menu item, the following dialog box appears:
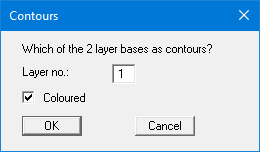
This menu item serves as a check for the layer depth input data. Enter the number of the layer for which you would like to see a contour diagram of the base. If you activate the "Coloured" check box, you will see a colour filled contour diagram. Otherwise, a normal contour diagram will be drawn.
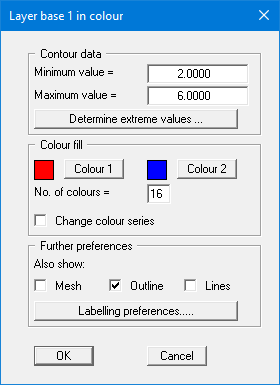
For colour-filled graphics you will see the above dialog box.
-
"Contour data" group box
Press the "Determine extreme values" button. The program then determines the minimum and maximum values for the corresponding layer base. You can then edit these values, for example to achieve a defined start value. -
"Colour fill" group box
You can control the colour subdivisions of the contour diagram using "No. of colours". In the example above, 16 colours will be displayed between "Colour 1" and "Colour 2". The default setting is a colour course from red to blue. These colours can be edited as required after selecting the "Colour 1" and "Colour 2" buttons, or simply reverse the choice by selecting the "Change colour series" check box. -
"Further preferences" group box
In addition to the colour presentation you can also have the triangle mesh and/or the outline displayed. Additional contour lines can also be drawn. Line labelling preferences can be defined by means of the "Labelling preferences" button. -
"OK"
The colours will be drawn after confirmation. A colour bar at the right edge of the sheet allows correlation between the colour and the corresponding value. If this colour bar is drawn in the right page margin, specify a larger value for the right plotting margin (e.g. 25 mm) in the "Page size + margins/Page size and margins" menu item.