
Finally, the deflection curve will be drawn through the slab centre. Go to the menu item "Evaluation/Values in node section" and click the central node on the left slab boundary and then the central node on the right slab boundary. To conclude, press [Return].
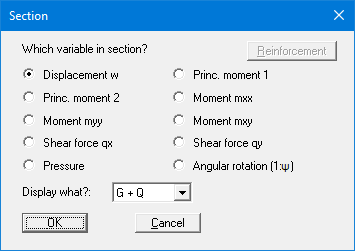
Activate the "Displacement w" option button and confirm using "OK". You can specify a number of preferences for the visualisation. The deflection curve is then displayed.
Go to the menu item "File/Print and export" if you want to print the deflection curve. You can display contours of displacements, moments, etc. in a similar manner (menu item "Evaluation/Normal contours", etc.) or determine the support forces (menu item "Evaluation/Support"). All node values can be annotated with the results in table form (menu item "Evaluation/Table"). You can generate circle charts displaying the respective state variables as circles of varying (value-dependent) size (menu item "Evaluation/Circles"). You can annotate the graphics using the "Mini-CAD" module or create a sheet header using the "Header CAD" module. Please see the Mini-CAD manual.
You can now reinforce the slab to DIN 1045 (menu item "System/Reinforce slab").
Save your analysis results to a file before carrying on (menu item "File/Save as").