
This menu item offers numerous options for processing your data.
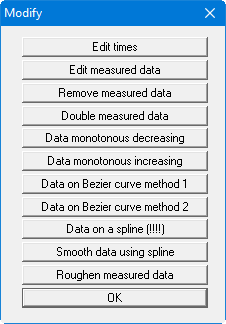
These actions directly alter your measured data. No "undo" is available for any actions with the exception of "Edit times" and "Edit measured data", i.e. you cannot reset any of the editing performed on the data.
Before you carry out any irreversible manipulations on your data, you should save the file under a different name in order to retain the original data.
-
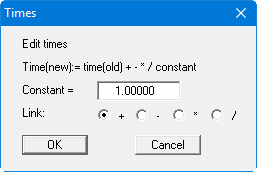
"Edit times"
By linking to a constant, you can convert the times associated with your values, e.g. from [seconds] to [minutes].
-
"Edit measured data"
You can edit your data by linking to a constant. This makes it very simple to correct reading errors for all data. -
"Remove measured data"
You can decrease the number of data by deleting every nth value. This kind of data reduction is recommended for particularly large records, where the evaluation would otherwise be extremely time intensive. -
"Double measured data"
If the number of data is very small, you can append a new value between two existing ones. This is done by means of linear interpolation. -
"Data monotonous decreasing"
The measured data can be arranged monotonous decreasing. -
"Data monotonous increasing"
The measured data can be arranged monotonous increasing. -
"Data on Bezier curve method 1"
You can connect the data points with the help of a Bezier spline curve. The algorithm employed here adheres strictly to the data points (= method 1). The number of data points to be considered for the curve can be entered in a dialog box.
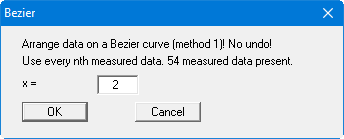
-
"Data on Bezier curve method 2"
The data points are connected by a Bezier spline, whereby the curve is smoothed out (= method 2). You enter the number of data to be used, just as in the previous action. -
"Data on a spline (!!!!)"
You can arrange the data points on a spline curve. After using this action a dialog box opens, in which you can specify the number of data to be included.
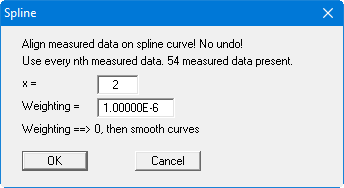
The weighting factor entered here influences the curve smoothing. The smaller the weighting, the smoother the curve.
-
"Smooth data using spline"
With the help of this action you can generate an orderly, evaluable curve from noisy data using a compensation spline. A dialog box opens, in which you specify the data points to be included as model points.
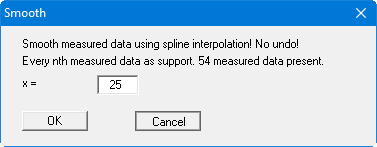
Depending on the precise condition of the dataset you must select a more or less large separation of the model points to achieve a relatively smooth curve.
-
"Roughen measured data"
This point was included to facilitate testing of the smoothing out methods described above. For example, if you have simulated a slug test according to your specifications using the "Test design" menu, i.e. calculated the data for a given permeability, you can make these data noisy by any figure. Enter a maximum roughening value in metres into the dialog box and specify whether the roughening is proportional to the respective measured data. -
"OK"
You will leave the menu item.