
In a dialog box you can define preferences and alter the appearance of the graph and the type curves.
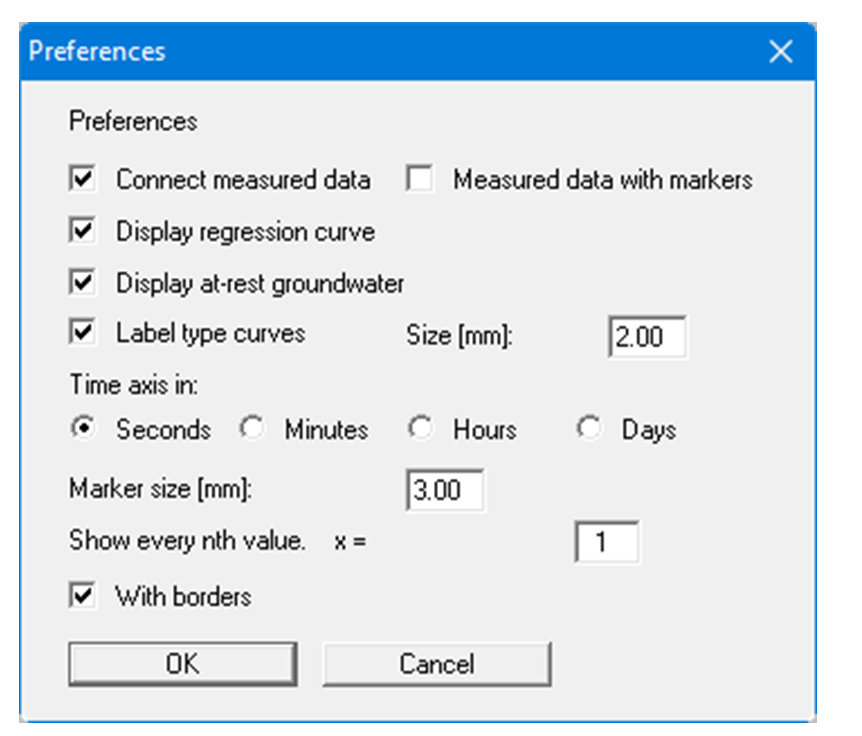
You can connect the data points to a curve and have the data points marked by a circle. The number and size of the markers can be specified at the bottom of the dialog box.
By activating the appropriate check box you can display the regression curve (HVORSLEV, BOUWER & RICE) in the graphics. You can also choose to display the at-rest water level.
If you wish to have the type curves annotated, activate the corresponding check box and, if necessary, enter a different text size. By activating the required dimension for the time axis the representation can be displayed in seconds, minutes, hours or days.
After confirming your input with "OK" the graph is redrawn according to your preferences.