
Blow counts greater than the specified boundary value, i.e. the specified maximum blow count, are often achieved in the lower reaches of the dynamic probing diagram. However, it may occasionally be necessary to be able to read the blow count from the diagram. In this case, activate the "Label blow counts > maximum blow" check box in the "Preferences/General" menu item. All blows over and above the defined maximum blow count are then entered at the right of the respective depth line.
If you need more than just a graphical evaluation of your test data the blow count can also be shown in a table adjacent to the dynamic probing diagram. Activate the table group box in the dynamic probings general editor box using the "As additional table" check box:
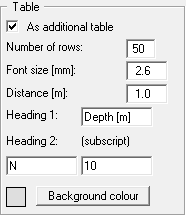
To achieve visualisation with a table row corresponding to a penetration depth of 10 cm (same graphical end depth for both the diagram and the table), define a font size of 1.3 mm for an overall image scale for the y-direction of 1:50. The font size in the example file should therefore be 2.6 mm for a scale of 1:25.
The number of lines should be adjusted to the probing depth, i.e. 10 lines per 1 m depth. The distance is given in m in the current x scale, measured from the right diagram edge. You can edit the column headings and give a background colour for the table.