
You can activate and define a legend for cone resistance, in analogy to the dynamic probing legend (see example file "Ex_CPT 2.bop"). However, you here define ranges for cone resistance in the dialog box that you reach clicking on the "Values" button. If the "Cone resistance qc coloured" check box is activated, the cone resistance diagram is shown in colour in accordance with the defined boundary values.
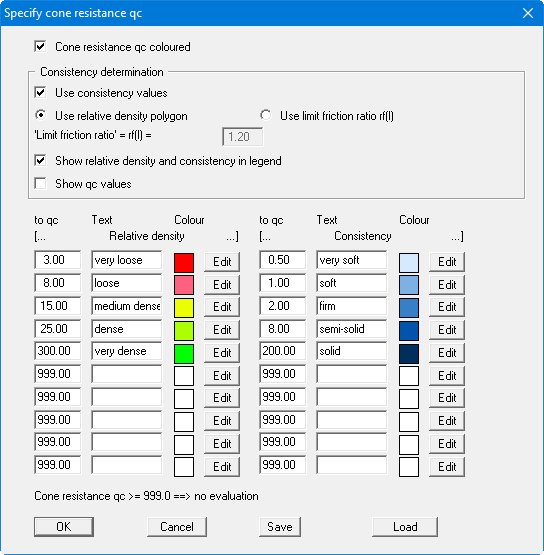
In addition to allocating a relative density that correlates to the cone resistances, you can also have consistencies defined based on qc, if the "Use consistency values" check box is activated. Use the radio buttons at the bottom to select whether the relative density or consistency values are adopted. You can "Use relative density polygon", which you specify in the "CPTs (soil index)" legend. Alternatively, the distinction can also be made by the value you specify for the limit friction ratio rf(l).
Relative density and consistency can be entered as headings in the legend. Moreover, you can have your defined qc values displayed in the legend after the respective texts for relative densities and consistencies. Save your settings in the "GGU-STRATIG.ggu_cpt" file so that they are automatically loaded when the program is started.