
Using this menu item, you can visualise inclinometer measurements as a diagram. When you select this menu item you will first see a dialog box in which you can create a new inclinometer diagram using the "New" button or select an existing inclinometer diagram for editing by clicking on the corresponding button.
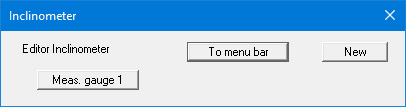
The example file "Ex_Inclinometer.bop" contains a diagram with inclinometer measurements. After clicking the "Meas. gauge 1" button the following editor box for the selected inclinometer diagram opens
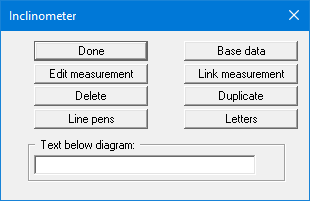
The following actions are possible clicking the buttons of the dialog box:
-
"Done"
You will arrive back at the previous dialog box. Alterations will be accepted. -
"Base data"
You can enter or edit the base data for the corresponding inclinometer diagram. -
"Edit measurement"
A further dialog box opens, in which you can enter up to 30 measurements for this data point. -
"Link measurement"
You can change an existing measurement in a dialog box by subtracting or adding a second existing measurement. For this, the same number of measured values must be present in both measurements. -
"Delete"
The currently displayed inclinometer diagram will be deleted. -
"Duplicate"
By clicking this button, you can duplicate the current inclinometer diagram. You will then find yourself in the "Base data" dialog box of the duplicated diagram. -
"Line pens"
You can define an A and a B pen for each of the 30 measurements using different colours and pen thicknesses. -
"Letters"
The A and B values of every measurement are assigned a letter, which can be used in the subsequent graphics for better identification. You can define the letters in advance for all possible measurements using this button. The letters can also be altered later in the data for the individual measurements. -
"Text below diagram"
In this field you can enter a text that will be displayed below the measured value diagram. To create a line break in the text, enter a "#" character.