
You can visualise Eijkelkamp Penetrologger measurement data as a diagram using this menu item. In this menu item a dialog box opens allowing a new penetrologger diagram to be created by pressing the "New" button, or an existing penetrologger diagram to be edited by clicking the button with the name of an existing penetrologger diagram.
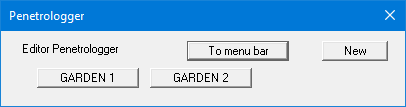
The example file "Ex_Penetrologger.bop" contains a diagram with 2 penetrologger measurements. After clicking the "GARDEN 1" button, the following editor box for the selected penetrologger diagram opens
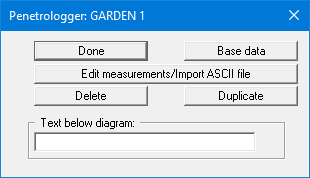
The following actions are possible clicking the buttons of the dialog box:
-
"Done"
You will arrive back at the previous dialog box. Alterations will be accepted. -
"Base data"
You can enter or edit the base data for the corresponding penetrologger diagram . -
"Edit measurements/Import ASCII file"
A further dialog box opens, in which you can enter up to 30 measurements for this data point. -
"Delete"
The currently displayed penetrologger diagram will be deleted. -
"Duplicate"
By clicking this button, you can duplicate the current penetrologger diagram. You will then find yourself in the "Base data" dialog box of the duplicated diagram. -
"Text below diagram"
In this field you can enter a text that will be displayed below the measured value diagram. To create a line break in the text, enter a "#" character.