
After clicking on the "Base data" button the following dialog box of the selected penetrologger diagram opens:
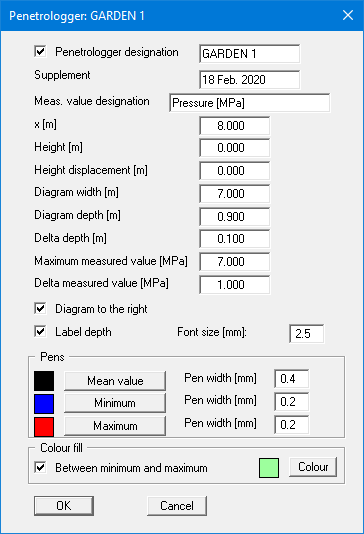
You can provide the penetrologger diagram with a designation, which can be supplemented by an entry in the "Supplement" box. Neither is shown on the output sheet if you deactivate the "Penetrologger designation" check box. However, the designation is always used to label the buttons in the above dialog box.
You define the position of the diagram on the page using "x", "Height" and "Height displacement". The remaining input defines the diagram's size and subdivisions. If the "Diagram to the right" check box is activated, the values will be entered into the diagram increasing to the right. Activate the depth labelling, which is displayed at the left or right of the diagram depending on the selected diagram orientation, using the "Label depth" check box.
Different pens are defined for the mean, minimum and maximum values of the measured data in the "Pens" group box. You can adapt the pen colours and widths. The region between the minimum and maximum values can be provided with a colour fill of your choice. If the colour fill is not required, simply deactivate the check box.