
Using this menu item you can add measured value diagrams (e.g. water content profiles, concentration distributions, etc.) to your drawing. A value pair giving the depth and associated measured value are required for each entry. The values will be displayed as depth orientated bars or connected as lines. The values axes can be subdivided linearly or logarithmically.
In this menu item a dialog box opens allowing a new measured value diagram to be entered, or an existing measured value diagram to be edited by clicking the button with the name of the existing test. A measured value diagram named after the corresponding probing is reproduced in the example file "Ex_Measured values + table.bop". After clicking the "RCS 3" button the following editor box for the selected measured value diagram opens:
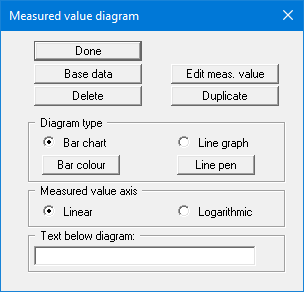
The buttons and switch boxes of this central input box will now be explained:
-
"Done"
You will arrive back at the previous dialog box. Alterations will be accepted. -
"Base data"
You will see the following the following dialog box, which is structured similarly to a dynamic probing. You can hide the diagram designation in the screen display by deactivating the corresponding check box.
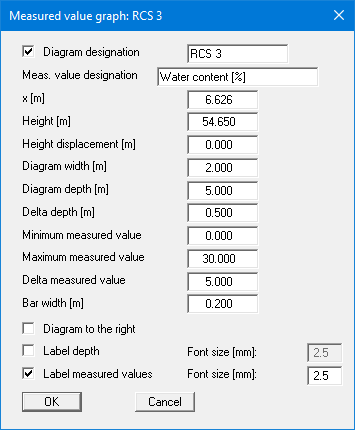
If the "Diagram to the right" check box is deactivated, the measured values are entered into the diagram rising to the left. Use the "Label measured values" and "Label depth" check boxes to activate the respective labelling, which is displayed on the right or left of the diagram depending on the selected diagram orientation. You can specify the font sizes separately.
-
"Edit meas. value"
A further dialog box opens allowing new value pairs to be entered or existing pairs to be edited. The number of value pairs is entered after pressing "x meas. values to edit". If more than 12 value pairs are defined you can navigate through the list using the "Forw." and "Back" buttons. Jump directly to the required value pair by entering the measured value number and clicking "Go to". The input is adopted by clicking the "Done" button. -
"Delete"
The current measured value diagram can be deleted. -
"Duplicate"
The current measured value diagram will be duplicated. You will then find yourself in the "Base data" dialog box of the duplicated diagram. -
"Bar chart"/"Line graph"
Use these selection buttons to determine the shape of the diagram. -
"Bar colour"
You can edit the bar colour. -
"Line pen"
You can edit the pen width and the pen colour of the line graph. -
"Linear" und "Logarithmic"
You can edit the axes subdivisions. -
"Text below diagram"
In this field you can enter a text that will be displayed below the measured value diagram. To create a line break in the text, enter a "#" character.