
Using this button contour lines can be drawn with a colour fill.
-
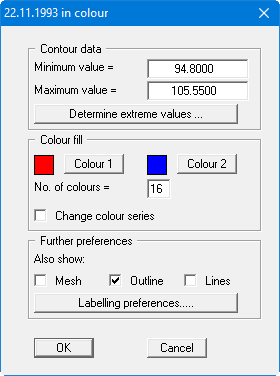
"Contour data" group box
The "Determine extreme values …" button computes the minimum and maximum values and enters them into the appropriate input boxes. However, you need not retain these values, but can also define your own. If, based on the example shown in the dialog box above, you set the minimum value to 94.50 and the maximum value to 106.00, you will get a colour change every 50 cm using 24 colours.
No smoothing of the contour lines can be performed here.
-
"Colour fill" group box
Using "No. of colours" you can control the colour subdivisions of the contour line diagram. In the example above, 16 colours will be displayed between "Colour 1" and "Colour 2". The default setting uses a colour course from red to blue. These colours can be edited as wished after selecting the "Colour 1" and "Colour 2" buttons, or simply reverse the choice by selecting "Change colour series". -
"Further preferences" group box
In addition to the colour presentation you can also have the triangle mesh and/or the outline displayed. Additional contour lines can also be drawn. Line labelling preferences can be defined by means of the "Labelling preferences" button. -
"OK"
The colours will be drawn after confirmation.
A colour bar at the right edge of the sheet allows correlation between the colour and the corresponding value. If this colour bar is drawn in the right page margin, specify a larger value for the right plotting margin (e.g. 25 mm) in the "Page size + margins/Page size and margins" menu item.