
After clicking "New" or one of the buttons of an existing data point the following dialog box opens.
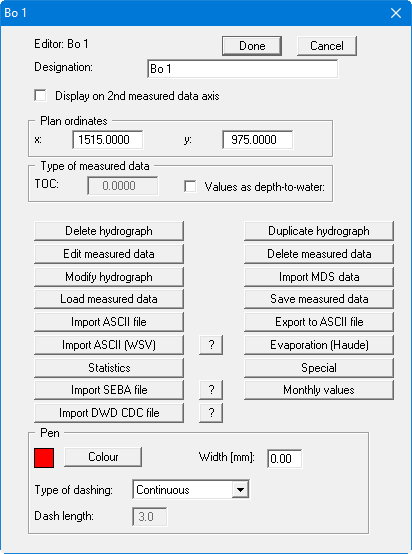
At the top of this dialog box you can enter the name of the data point and edit the x- and
y-ordinates. If you would like to display this data point later in a second diagram in the hydrograph visualisation, activate the "Display on 2nd data axis" check box.
By clicking the "Done" button you return to the previous dialog box; any changes will be accepted. Using the "Cancel" button you leave the dialog box and any editing is rejected.
If the measured values you are dealing with are groundwater levels, you can activate the "Values as depth-to-water" check box. In the activated "TOC:" box (top of casing) you enter the m AD height for the top of the casing of the well. When subsequently entering the measured values you can simply give the water level on the water level sounding light in metres. The program converts the groundwater levels automatically to [m AD] for hydrograph visualisation and displays them.
The values entered remain unchanged. Only the hydrograph visualisation on the screen (or printed) is adjusted accordingly.
Preferences for visualisation of the hydrograph of the current data point, such as colour, width and type of dash, are defined in the bottom group box ("Pen").
In addition to the buttons described in more detail in sections "Edit measured data" button to "Monthly values" button , the following operations can be carried out here:
-
"Delete hydrograph"
The currently displayed data point can be deleted. If a triangle mesh has been generated to enable contour line display based on the existing data points, it will also be deleted. -
"Duplicate hydrograph"
The currently displayed data point can be copied. All current data will be copied. You will then find yourself in the box for the duplicated data point, titled "New". -
"Edit measured data"
A description of this button can be found in Section "Edit measured data" button. -
"Delete measured data"
You can decide in a dialog box whether to delete all or every 2nd measured value for this data point. -
"Modify hydrograph"
A description of this button can be found in Section "Modify hydrograph" button. -
"Import MDS data"
Measured data collected using a data acquisition system (e.g. MDS cells) can be imported as ".dst" files and be further processed by the program. -
"Load measured data"
You can load measured data from a GGU-TIME-GRAPH data file (".gng" extension). If you select "New", the current data are deleted. In order to add data to the current record, select "Append". -
"Save measured data"
The measured data for the current point are saved in a special data format with the ".gng" extension. -
"Import ASCII file"
A description of this button can be found in Section "Import ASCII file" button. -
"Export to ASCII file"
The measured values can be saved as an ASCII file with the ".txt" extension and then edited, for example with a text editor. -
"Import ASCII (WSV)"
Measured data provided in ASCII format by http://www.pegelonline.wsv.de/ can be imported into the program and processed. -
"Evapotranspiration (Haude)"
You can have the evapotranspiration calculated after Haude. You must either enter one hydrograph with the temperature data and one with the humidity data or import an appropriate ASCII file.
You must generate a new hydrograph for the evapotranspiration values. Allocate the hydrographs to the appropriate drop-down list boxes to calculate the values. The evapotranspiration values are calculated from the temperature and humidity values and transferred to your hydrograph as new values. -
"Statistics"
A description of this button can be found in Section "Statistics" button -
"Special"
A description of this button can be found in Section "Special" button. -
"Import SEBA file"
Measured data saved in ASCII format by SEBA automatic recording instruments can be imported into the program and processed. -
"Monthly values"
A description of this button can be found in Section "Monthly values" button. -
"Import DWD CDC file"
Measurement data from DWD, saved as a CSV file via the https://cdc.dwd.de/portal/ portal, can be imported into the program and processed.