
When visualising hydrographs a descriptive legend can be displayed with the allocations for lines and markers to the hydrographs of the selected data. The position and appearance of the legend can be modified if the "Show legend" check box in this menu item's dialog box is activated.
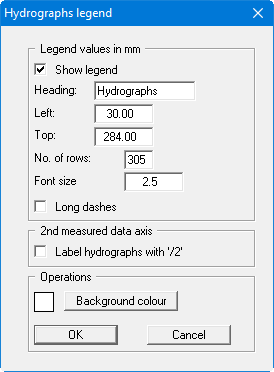
A text can be specified as legend header. You can define and edit the position of the legend using the values "x" and "y". You control the size of the legend using "Font size" and "Max. no. of lines"; where necessary, several columns are used. The fastest way to modify the position of the legend is to press the [F11] function key and then to pull the legend to the new position with the left mouse button pressed.
If you have defined visualisation of your data points on 2 data axes, activate the "Label hydrographs with '/2'" check box. This means that all data points from the 2nd diagram are appropriately identified.
The legend can be provided with a coloured background fill; the colour can be edited via the "Background colour" button.