
The following dialog box opens for graphical visualisation of the hydrographs:
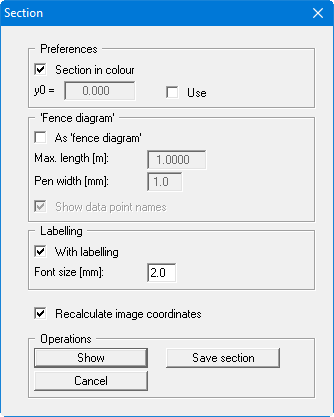
If the "Section in colour" check box in the "Preferences" group box is activated the whole area of the data is filled. The colours and hatching defined in the menu item "Section/Pens (section)" are used.
You can also define the intercept of the x-axis with the y-axis ("y0"). In this case the "Use" switch must be activated. If you decide not to make use of this option, the x-axis will intercept the y-axis at the smallest occurring value of y. For example, use of a fixed value for "y0" is useful if you need to visualise a number of sections and all need to be drawn with the same base line.
You can also display your measured data in section as a fence diagram.
In the "Labelling" group box you can specify preferences for automatic section labelling. When activated the program inserts a table, containing the selected values at the points defined, below the section. The labelling font size can be altered to suit requirements.
If you have activated the "Recalculate image coordinates" check box, the program will calculate the optimum image coordinates each time. If you need a section with fixed coordinates and a constant scale, which you may want to save as a section for long-term studies, you should always deactivate this check box. The coordinates can be edited using the menu item "Page size + margins/Manual resize (editor)".
In the "Operations" group box the current section can be saved to a file using the "Save section" button. The coordinate and scale settings, and all Mini-CAD elements displayed in the current section are saved with the file. This can be used, for example, to define the course of a section for a special embankment profile, enabling long-term observation and visualisation of the phreatic lines, as the following figure illustrates.
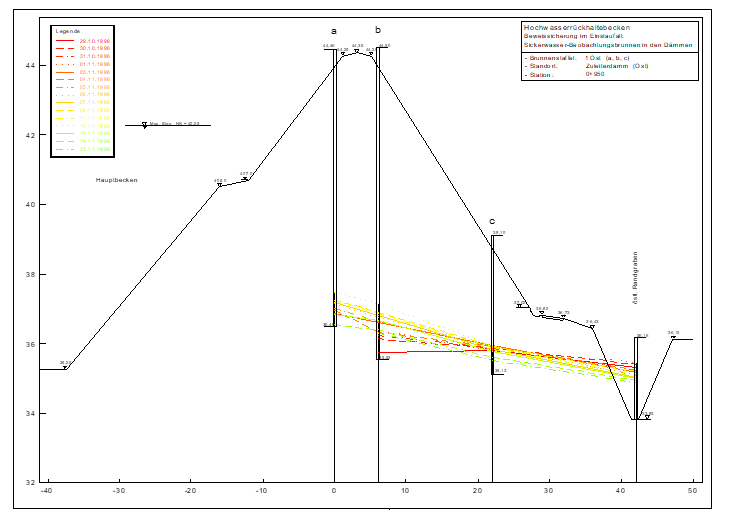
The section will be drawn on the screen after clicking the "Display" button. In addition, a legend showing the date allocation to the graph used and a location map, showing the system outline and the defined section, are automatically displayed. These legends (data and section course) are activated by default, but can be deactivated in the menu items "Graphics preferences/Section course legend" and "Graphics preferences/Date legend".