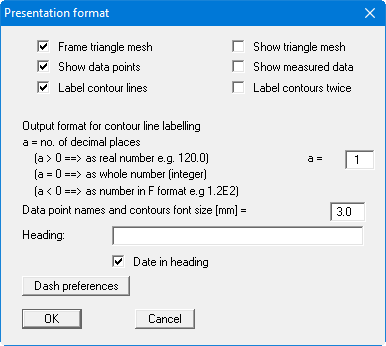
In the dialog box you can specify preferences for the type of presentation and for contour line labelling.
-
"Frame triangle mesh"
A thin line is drawn around the outer edge of the mesh. -
"Show triangle mesh"
All triangles in the mesh are drawn. -
"Show data points"
The points and corresponding point names are displayed. -
"Show measured data"
The measured data at the corresponding points are displayed. -
"Label contours"
The contours are labelled, the text is positioned approximately in the centre of the contour lines. -
"Label contours twice"
The contours are labelled at both ends. -
"Heading"
You can enter a text here to be displayed in the General legend. -
"Date in heading"
If you activate this check box the selected date for the contour line visualisation is automatically inserted after the heading text in the General legend.
If nothing has been defined as a heading and the "Date in heading" check box is deactivated, the General legend will only be displayed if one of the file name display check boxes in the dialog box is activated.
In addition, the number of decimal places and the font size can be defined for contour labelling, as well as the font sizes for the measuring point labelling.
The "Dash preferences" button opens the following dialog box
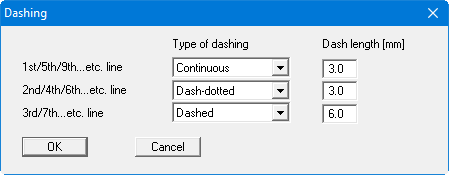
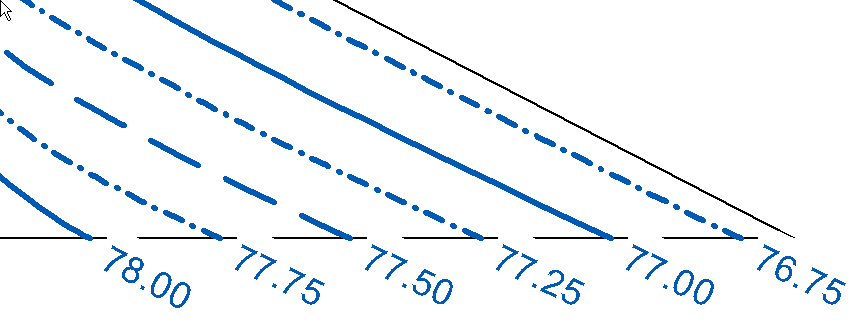
For example, if you want to display groundwater diagrams depicting large areas, the contour labelling may be very widely spaced. The settings in the above dialog box would lead to the following contour lines for a selected contour spacing of 0.25 m.