
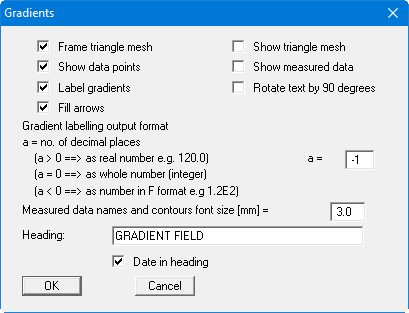
In the dialog box you can specify preferences for the type of presentation and for gradient labelling.
-
"Frame triangle mesh"
A thin line is drawn around the outer edge of the mesh. -
"Show triangle mesh"
All triangles in the mesh are drawn. -
"Show data points"
The points and corresponding point names are displayed. -
"Show measured data"
The measured data at the corresponding points are displayed. -
"Label gradients"
The gradients are labelled with the gradient value. -
"Rotate text by 90 degrees"
Depending on the orientation of the gradient arrows, the labelling may be above the arrows. It may be useful for clear visualisation to rotate the labelling by 90°. -
"Fill arrows"
The gradient arrowheads are colour-filled with the colour given for gradients in the "Graphics preferences/Pen colour and width" menu item. If a different colour is required it must be specified here. -
"Heading"
You can enter a text here to be displayed in the General legend. -
"Date in heading"
If you activate this check box the selected date for the gradient visualisation is automatically inserted after the heading text in the General legend.
If nothing has been defined as a heading and the "Date in heading" check box is deactivated, the General legend will only be displayed if one of the file name display check boxes in the dialog box is activated.
In addition, the number of decimal places and the font size can be defined for contour labelling, as well as the font sizes for the measuring point labelling.