
Using this menu item the measured data can be visualised as contour lines. After completing new input and before using this menu item, a triangle mesh (interpolation mesh) must be defined (see the following Sections). The program utilises this triangle mesh as the basis for interpolation between the individual data points.
After going to the "Contours/Display" menu item you have to select the date for the measured data visualisation.
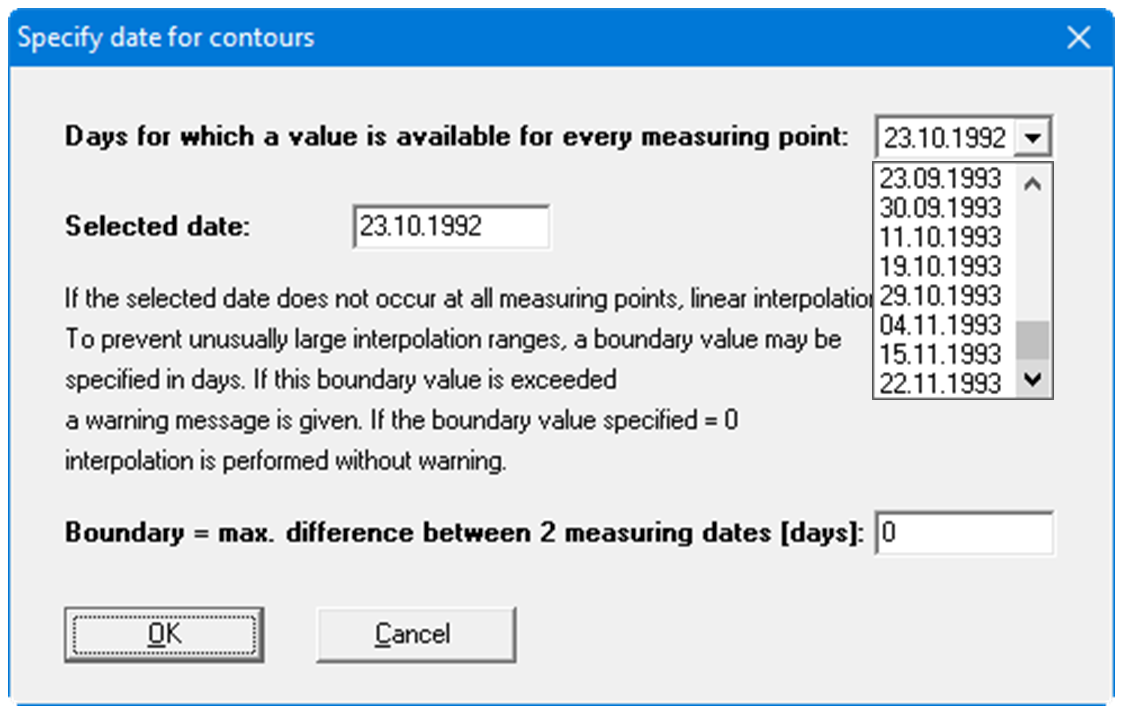
In the so-called "Combo box" (top right) all dates can be selected for which data is available at all wells. After selecting a date using the combo box it is displayed in the "Selected date:" input box. Alternatively, you can enter a date by hand in the "Selected date:" input box. If data is not available at all wells for this date the missing values will be determined by linear interpolation. Further details are explained by the text in the dialog box.
The hydrograph visualisation also allows a time of day to be taken into consideration. Only daily values can be taken into consideration for the visualisation using contour lines.
If, when editing the hydrograph, several measured data are available for a given date, the mean of all data is used for the contour line visualisation.