
After confirming the section course the following dialog box opens in all cases, allowing you to define the dates for which the measured data should be visualised as hydrographs in section. It is possible to visualise up to 40 date values. To specify the dates click on the "Arrow down" key and then click the required dates from the drop-down list boxes.
At the end of each list you can select "Maximum", "Minimum" or "Mean". The selected value is then determined for all available dates for each data point.
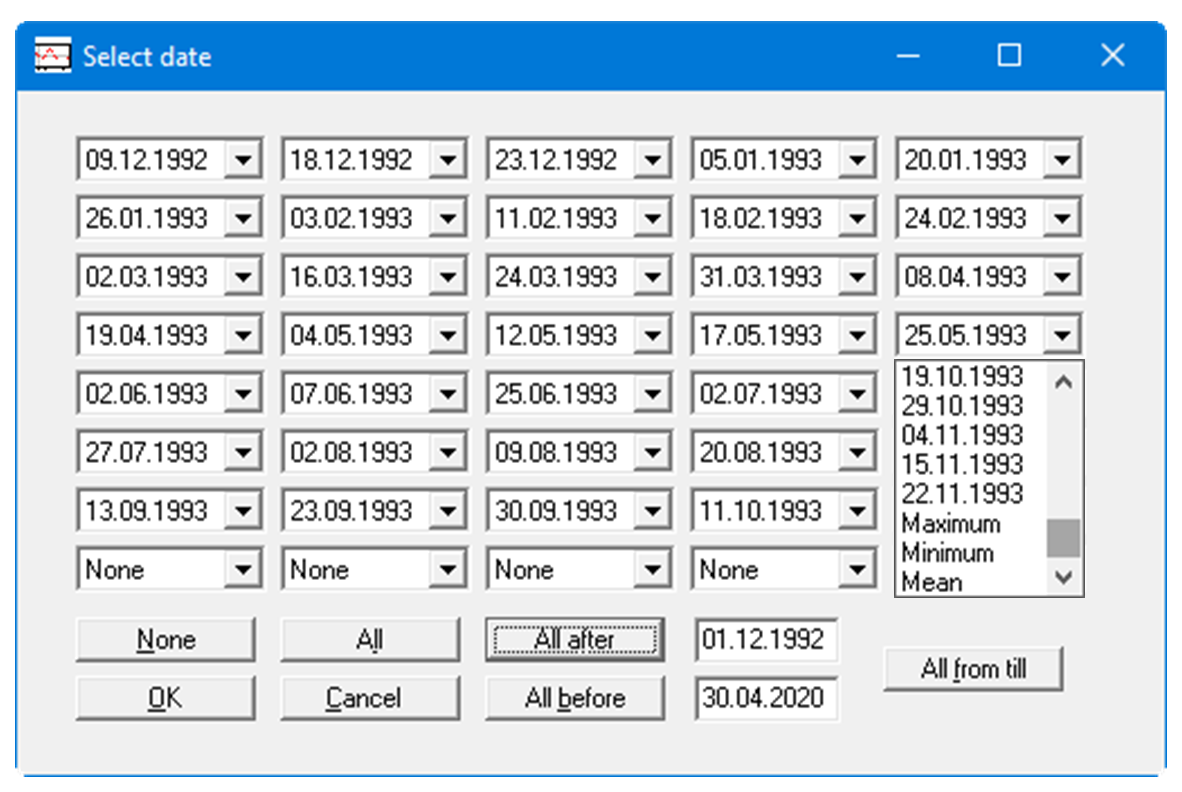
The complete list of dates can be switched on or off using the "None" and "All" buttons. If you have selected a number of dates, for example, and would then like to visualise only one date, first turn off all dates using "None" and then select the required date.
Alternatively, you can select all data before or after a specific date. To achieve this, enter the required date in the date box and click "All after" or "All before". You can also use the two date boxes to define a start and an end date for a given period. Then click the "All from till" button.
If the input is confirmed by pressing "OK" a dialog box opens allowing preferences for the section visualisation to be defined. The same dialog box opens by going to the "Section/Preferences" menu item.