
After selecting the required date the following dialog box opens allowing the type of contour visualisation to be specified, preferences for visualisation in general or the data to be output for other applications.
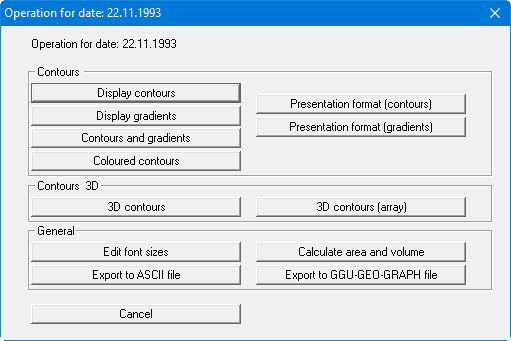
In addition to the buttons described in more detail in Sections "Display contours" button - "3D contours (array)" button, the following operations can be carried out here:
-
"Contours and gradients"
Allows combined presentation of contours and gradients. The settings for contour line representation are described in Section "Presentation format (contours)" button. The description of gradient representation can be found in Section "Presentation format (gradients)" button. -
"Edit font sizes"
You define the font sizes for axes labelling, etc. -
"Calculate area and volume"
The program computes the area and volume resulting from the data measured within the defined triangle mesh. If data smaller than zero is present, negative volume will also be computed. If the appropriate measured data are entered (e.g. ground level, thickness of topsoil, location of the excavation level) excavation volumes can also be computed. -
"Export to ASCII file"
You can generate an ASCII file with the current data, which can subsequently be processed further, for example in a spreadsheet. The coordinates of the triangle mesh and the corresponding measured values are exported. -
"Export to GGU-GEO-GRAPH file"
You can generate an GGU-GEO-GRAPH fileto facilitate exporting the measured data to the GGU-GEO-GRAPH application in order to process them further. -
"Cancel"
You exit the "Contours/Display" menu item.