
A dialog box for statistical evaluation of the stored values at this point opens. The statistical evaluation is carried out for the data range specified for the time axis of the hydrograph visualisation (see menu item "Page size + margins/Manual resize (editor)"). If only a portion is visualised, only this portion will be taken into consideration in the statistics. In this case, however, a warning is issued beforehand, allowing the complete data range to be used in the evaluation.
A statistical evaluation is all the more meaningful the more measured data is available.
It is therefore always more expedient to work with the complete data range.
The "Example_02_statistics.gis" example file was used in the following dialog boxes.
Minimum and maximum values, variance and standard deviation, as well as extreme events and probabilities, can be calculated for a given number of months or years by means of a further dialog box.
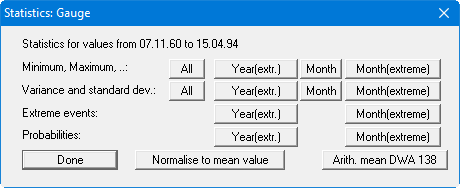
You can determine the mean of all measured data using the "Normalise to mean value" button. To do this, first duplicate your hydrograph in the data point editor and then determine the mean. The mean is now defined as zero, allowing you to visually recognise temporal deviations from the mean.
You can determine the mean of all measured data using the "Normalise to mean value" button. To do this, first duplicate your hydrograph in the data point editor and then determine the mean. The mean is now defined as zero, allowing you to visually recognise temporal deviations from the mean.
Using the "Arith. mean DWA 138" button, you can view a summary of the highest annual groundwater levels compliant with the analysis in DWA-A 138. You can transfer this data, for example to a text, via the Windows clipboard.
If you select the "Month(extreme)" button in the "Extreme events" line in the dialog box above, you must first enter the recurrence interval to be calculated.
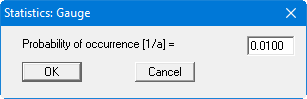
The number shown in the box above, for instance, means a recurrence interval of "once in 100 years". The values are then calculated and displayed.
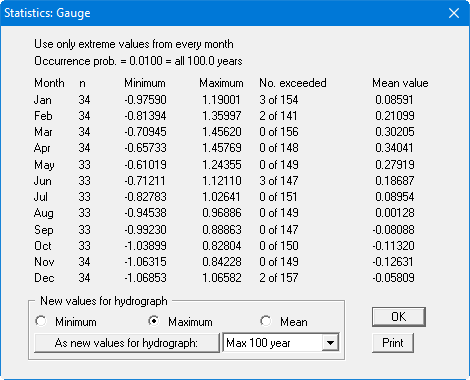
The "Print" button facilitates data output to a printer or, alternatively, to a file. The date values are then positioned at the 15th of each month. They are printed again for the whole period every time you press the print button.
The results for "Minimum", "Maximum" or "Mean" can be allocated directly to a hydrograph via the "As new value for hydrograph:" button; the hydrograph can be specified in the drop-down list box beside the button.
For direct allocation a hydrograph must be previously defined (e.g. using "Hydrographs/Editor 1" button "New"), because only existing hydrographs are listed in the drop-down list box.
The hydrographs for "Mean", "Max 100 year" and "Min 100 year" in the
"Example_02_statistics.gis" file were calculated from the gauge hydrograph in this manner.