
You can influence the appearance of the time axis in the graphical visualisation. When the program starts, the display is defined with date shown. The following dialog box opens:
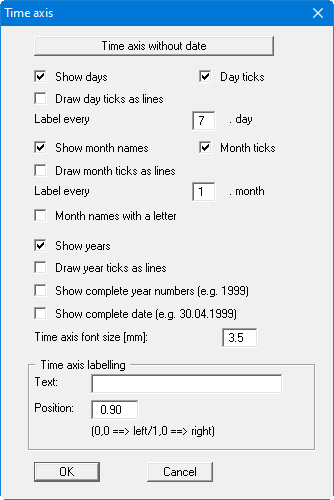
The various preferences can be selected after activation of the check boxes "Show days", "Show month names" and "Show years". The date can be rotated by 90° using the "Show complete date" check box. You can also enter and position your own labelling for the time axis in the lower group box.
Labelling is foregone if there is not enough room for your chosen visualisation.
For example, if you have selected "Show days" and "Label every 1st day" (every day), the space available is generally insufficient. It is then better to label at every 7th day.
If you want to display only a period without the date displayed, first click the "Time axis without date" button at the top of the dialog box. The following adapted dialog box opens:
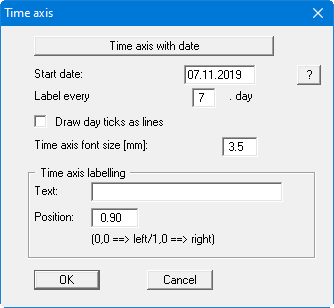
In the upper input box, you can specify a start date that is defined as "0" on the time axis. The days are counted from here.
The range displayed on the time axis (start date and end date) is defined via the menu item "Page size + margins/Manual resize (editor)".
To return to a time axis with date display, click on the "Time axis with date" button in the above dialog box. This takes you to the dialog box described on the previous page.