
Among other things, the screen graphics consist of several diagrams, presenting depth-oriented results. The represented variables can be specified in the dialog box for this menu item.
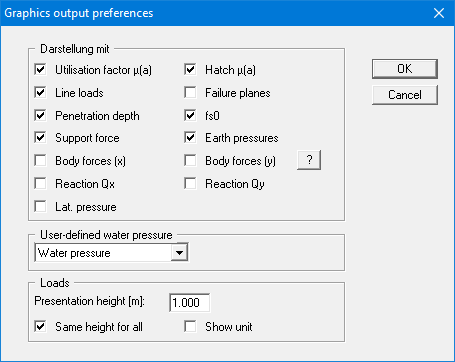
Depending on the verification concept selected, the "Safety factor eta(a)" or the "Utilisation factor µ(a)" is displayed and hatched where specified. Body forces refers to the loads from line loads, soil self-weight, friction forces resulting from both cohesion and the friction angle on both flanks, and the cohesion force on the front of the wall. The reaction force Q is the force resulting from the friction angle on the front of the wall. The lateral pressure is represented without a component from any line loads present with a factor for the lateral pressure of > 0.0.
If you analysed using a user-defined water pressure, the screen graphics will display a diagram with the water pressure distribution. In the combo box you are given the option of displaying the potential or the gradient, instead of the water pressure.
Line loads and distributed loads are shown in the graphics at the height specified in the "Presentation height (loads)" field. If you deactivate the "Same height for all" check box, the largest load is displayed with the specified value and the remaining smaller loads displayed in proportion to this. The unit can also be displayed by activating the "Show unit" check box.
The program automatically scales the graph width to fit.
If the system coordinates are modified, e.g. using "Page size + margins/Manual resize (editor)", or by adding further graphics, all graphs are rearranged uniformly within the available space.