
If the "Show system" check box is activated in the following dialog box you will see a graphics of your groundwater system and the analysis results represented within it. In the upper field you define your preferences for the system in general, and in the lower group box you can influence the appearance of your calculation results. If you have activated the Aulbach/Ziegler method, only the uppermost settings are available.
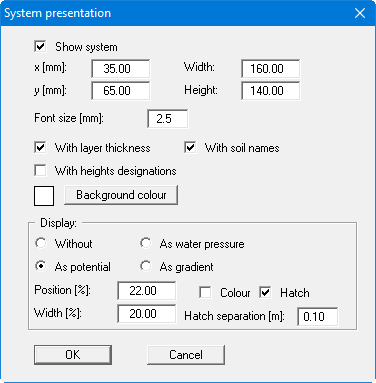
Representation uses the "x" and "y" coordinates defined, together with "Width" and "Height". You also define the "Font size" for labelling. The legend background can also be given a colour fill. The fastest way to modify the position of the system graphics is to press the [F11] function key and then to pull the legend to the new position with the left mouse button pressed.
-
"With layer thickness"
The layer thicknesses are represented using dimension lines. -
"With soil names"
The defined soils are represented with their respective names. -
Display: "Without", "As water pressure", "As potential", "As gradient".
The results of the groundwater analysis are presented according to the option buttons selected in the display group box. -
"Position", "Width"
You enter the position and width of the result presentation in percentage values; this allows the results to always be presented in the same position within the system, and with the same percentage width, even if the total width of the system representation is altered. -
"Colour", "Hatch"
The results can be presented either in colour or hatched; the colour used is that defined in menu item "Graphics preferences/Pen colour and width" for "Water pressure". The hatch separation is defined in the text box below this.