
The water level in the blanket layer is displayed as a circle chart (also see menu item "Evaluation/Circles").
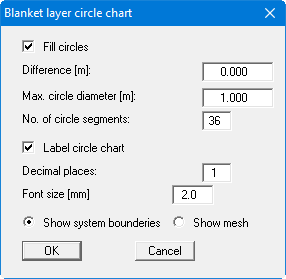
If your system contains several blanket layer zones with varying water levels, you can display circles with substantially different sizes, depending on the water level, by entering a value that is marginally larger than the smallest prevalent water level in the "Difference" input box.