
"Soil properties legend" menu item
A legend with the soil properties of the individual layers will be displayed on your output sheet. If you have activated the "Show legend" check box, you can alter the type of visualisation using the dialog box of this menu item.
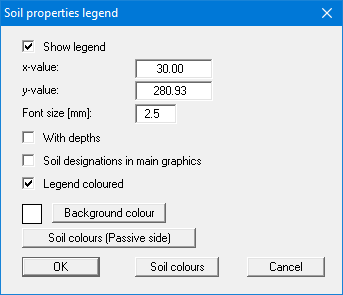
You can define and edit the position of the legend using the values "x" and "y". You control the size of the legend using "Font size". The fastest way to modify the position of the legend is to press the [F11] function key and then to pull the legend to the new position with the left mouse button pressed.
"With depths"
The depths of the individual soil layers will be shown in the soil properties legend.
"Soil designations in main graphics"
The designations entered for the individual ground layers are displayed in the system graphics adjacent to the layer depths.
"Legend coloured"
The soil colours are displayed in the legend. Otherwise, they will be numbered.
"Background colour"
The legend can be assigned a background colour.
"Soil colours"
If, in the menu item "Editor 1/Analysis options", you have activated the "Differentiate active + passive soil properties" check box, the "Soil colours (passive side)" is also displayed.
After clicking one of the buttons you will see a dialog box, in which you can define your preferences. After clicking the button with the desired number, you can assign each soil layer a new number or reorganise using the "Soil colours/Reorganise" command button. You can save your colour preferences to a file with "Soil colours/Save" and use them for different systems by means of the "Soil colours/Load" command button. In the lower group box you can also transfer the colour preferences to the Windows colour management dialog box, or vice versa, as user-defined colour preferences for example. You can read a further description by pressing the "Info" button.
"General legend" menu item
A legend with general properties will be displayed on your output sheet. If you have activated the "Show legend" check box, you can alter the type of visualisation using the dialog box of this menu item.
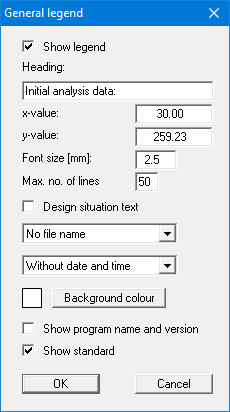
You can define and edit the position of the legend using the values "x value" and "y value". You control the size of the legend using "Font size" and "Max. no. of lines"; where necessary, several columns are used.
The fastest way to modify the position of the legend is to press the [F11] function key and then to pull the legend to the new position with the left mouse button pressed.
In the General legend you can, if wished, display information on the program (name and version), on the adopted standard and on the current file (name, path, time info). Any project identification entered in the "File/New" or "Editor 1/Analysis options" dialog box will also be shown in the General legend . The legend can be assigned a background colour.
"Design legend" menu item
Following analysis and design a legend containing the principal system design results is displayed on the screen. Using this menu item you can alter the type of presentation if the "Show legend" check box is activated.
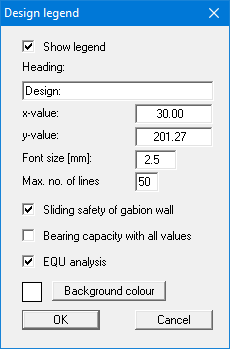
You can define and edit the position of the legend using the values "x value" and "y value". You control the size of the legend using "Font size" and "Max. no. of lines"; where necessary, several columns are used.
The fastest way to modify the position of the legend is to press the [F11] function key and then to pull the legend to the new position with the left mouse button pressed.
By activating the "Bearing capacity with all values" check box the bearing capacity, shape and inclination coefficients will be displayed in the legend. Result display for the sliding safety (gabion wall) and the EQU analysis can also be activated. These values are automatically contained in the output table that can be opened using the "File/Print output table" menu item (see section 8.1.5). The legend can be assigned a background colour.
"Settlement legend" menu item
Following analysis and design a legend containing the principal results of the settlement analysis is displayed on the screen. Amongst other things, the share of the settlement for each individual layer can be taken from this legend. Using this menu item, you can alter the type of presentation if the "Show legend" check box is activated.
You can define and edit the position of the legend using the values "x value" and "y value". You control the size of the legend using "Font size" and "Max. no. of lines"; where necessary, several columns are used. The fastest way to modify the position of the legend is to press the [F11] function key and then to pull the legend to the new position with the left mouse button pressed. The legend can be assigned a background colour.
"Reinforced soil system legend" menu item
After you have analysed a system employing a reinforced soil body, a legend containing the basic assumptions and results of the analysis can be displayed. Using this menu item, you can alter the type of presentation if the "Show legend" check box is activated.
You can define and edit the position of the legend using the values "x value" and "y value". You control the size of the legend using "Font size" and "Max. no. of lines"; where necessary, several columns are used. The fastest way to modify the position of the legend is to press the [F11] function key and then to pull the legend to the new position with the left mouse button pressed. The legend can be assigned a background colour.
"Geogrid legend" menu item
Where geogrids are employed in the system it is possible to display a corresponding legend by activating the "Show legend" check box in this dialog box.
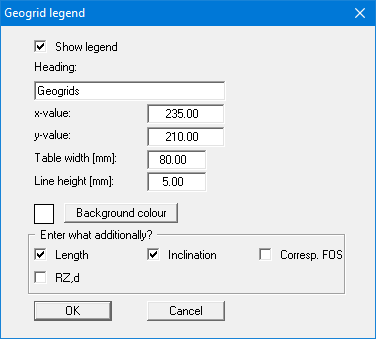
The legend takes the form of a table. The font size can be controlled by means of "Table width" and "Line height". The table can be assigned a background colour. In the lower group box, it is possible to select additional data to be included in the table.
"Quick header" menu item
Using this menu item it is possible to display a simple header containing company data. Activate the "Show legend" check box and enter your data.
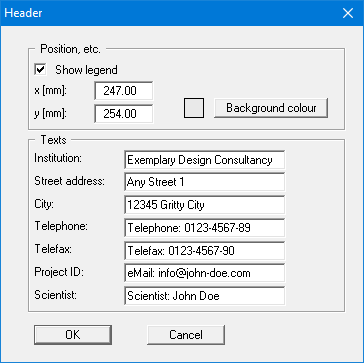
You can define and edit the position of the header legend using the values "x" and "y". The legend can be assigned a background colour.
"Move objects" menu item
Select this menu item in order to position legends or other graphical elements at the desired position on the output sheet. You can also move objects by pressing the [F11] function key and then positioning the objects with the left mouse button pressed. In that case an info-box appears no more.
If "Manual graph positioning" has been selected in the "System/Graph positioning preferences" menu item (see section 8.5.5), the result graphs can also be repositioned using this function.
"Save graphics preferences" menu item
Some of the preferences you made with the menu items of the "Graphics preferences" menu can be saved to a file. If you select "GGU-GABION.alg" as file name and save the file on the same level as the program, the data will be automatically loaded the next time the program is started and need not be entered again.
If you do not go to "File/New" upon starting the program, but open a previously saved file instead, the preferences used at the time of saving are shown. If subsequent changes in the general preferences are to be used for existing files, these preferences must be imported using the menu item "Graphics preferences/Load graphics preferences".
"Load graphics preferences" menu item
You can reload a graphics preferences file into the program, which was saved using the "Graphics preferences/Save graphics preferences" menu item. Only the corresponding data will be refreshed.