
This menu item is a graphics format consisting of elements taken from bar charts (value-dependent colour-fill) and circle charts. However, the size of the symbols remains constant. In analogy to circle charts you first select a parameter to be represented by symbol charts. You will then see the following dialog box:
The symbol size can be defined by means of the radius. The symbol shape can be altered by means of the number of segments. Using the "Presentation format" button it is possible to alter the settings for symbol presentation in analogy to the description given in the menu item "Graphics/Contours (normal)" (see Section "Presentation format" button). A heading can be entered in the preferences dialog box; this is used as the heading for the general legend.
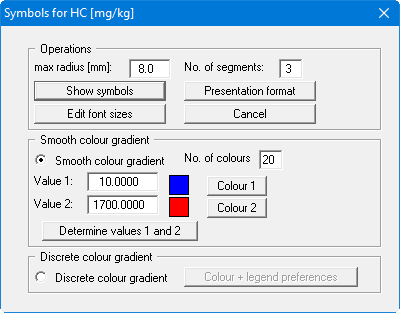
You can choose between two types of colour fill: