
After selecting the "Normal" button, mark the parameters to be represented as bar charts in the dialog box. If several parameters are marked they will be displayed side by side or stacked.
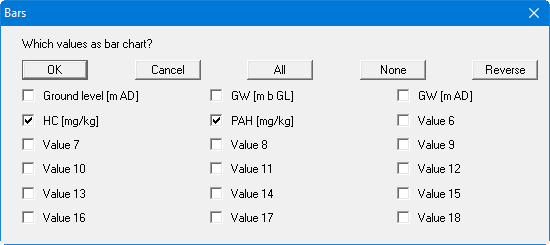
With the "All" button, all parameters can be activated or deactivated. Once you have confirmed your selection with "OK" the following dialog box opens:
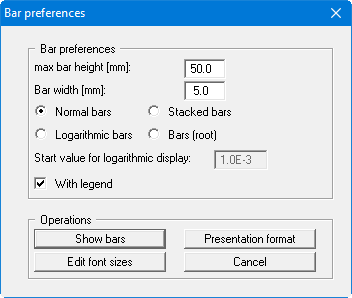
Besides height and width of the bars, you must specify the format of the bar charts. An additional starting value must be provided for a logarithmic bar representation. The difference between the measured value and the starting value is then represented on a logarithmic scale.
Using the "Presentation format" button it is possible to alter the settings for bar presentation in analogy to the description given in the menu item "Graphics/Contours (normal)" (see Section "Presentation format" button). A heading can be entered in the preferences dialog box; this is used as the heading for the general legend If the "Bars coloured" check box is activated in the settings box the bars are visualised using the value colour of the selected data. Changes can be made by going to the menu item "Edit/Value colours".