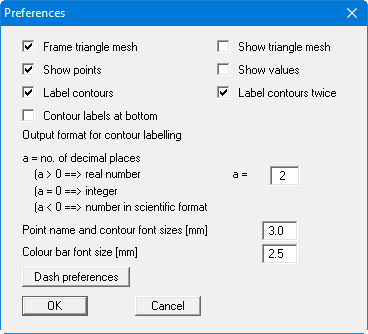
In the dialog box you can specify preferences for the type of presentation and for contour line labelling.
-
"Frame triangle mesh"
A thin line is drawn around the outer edge of the mesh. -
"Show triangle mesh"
All triangles in the mesh are drawn. -
"Show points"
The points and corresponding point names are displayed. -
"Show values"
The measured data at the corresponding points are displayed. -
"Label contours"
The contours are labelled, the text is positioned approximately in the centre of the contour lines. -
"Label contours twice"
The contours are labelled at both ends. -
"Contour labels at bottom"
Normally, contour lines are labelled towards the increasing side of the lines. This can lead to labelling on its head. Activate this check box if you always want the labelling aligned for reading.
In addition, the number of decimal places and the font size can be defined for contour labelling, as well as the font sizes for the point and colour bar labelling.
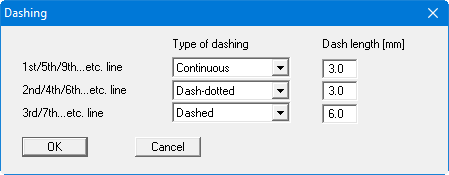
The "Dash preferences" button opens the following dialog box:
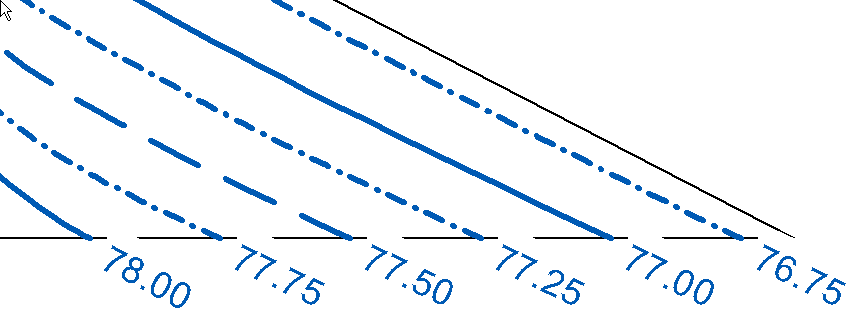
For example, if you want to display groundwater diagrams depicting wide areas, the contour labelling may be very widely spaced. The settings in the above dialog box would lead to the following contour lines for a selected contour spacing of 0.25 m.